Join The Club


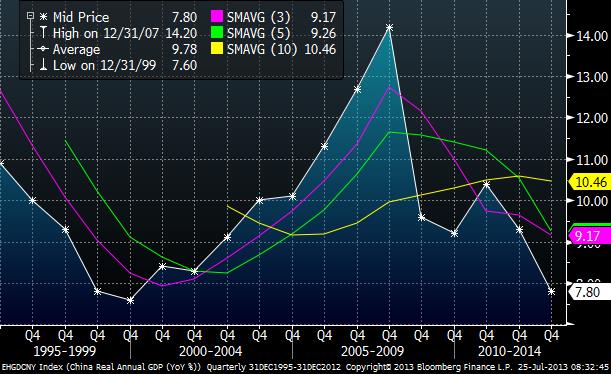
The first decade of the 21st century was marked by Chinese demand for industrial commodities to build and expand cities and infrastructure. The Chinese government’s policies led to one of the greatest economic expansions the global economy has experienced. China’s GDP growth rate, which had experienced a 7.6% growth rate in 1999, grew to 14.2% in 2007, only to fall to 9.2% by the end of 2009. As China has sought to rebalance its growth to ensure sustainability, it has structurally altered its focus by concentrating its infrastructure expansion away from its coast and more inland. In part, this has caused Chinese GDP to have slowed. Another reason for the slowing of economic growth has been China’s change in agricultural and food policy.
China’s stated policy for the past 15 years was to be self-sufficient in the production of three crops: corn, rice and wheat. It’s becoming clear that policy has been abandoned. China is becoming non-self-sufficient in grains and even rice. China represents 20% of the world’s population, but it only has 7% of global arable land. Increased urban and industrial development has substantially reduced the amount of per capita cropland. Chinese cropland erosion is resulting in soil loss of 40 tons per hectare each year, 4 times the erosion estimated in the U.S. and Europe.
China was a major exporter of grain but increasing incomes and the development of a middle class have changed consumers’ diets, moving away from carbohydrates towards proteins. China has gone from a net exporter to a net importer for much of its grain supply. The continued shift to higher protein will significantly increase the demand for grains as one pound of meat requires roughly 10 to 15 pounds of grain. China’s increase in soybean imports from virtually zero to 58 million tons in 10 years is an example of what may be in store.
China is in the process of reducing bureaucratic and regulatory restraints on the importation of agriculture. The cutting of red tape to allow China to import corn from Argentina was started two years ago and was finalized last year. And last year, China started cutting the same red tape to allow imports from Ukraine and received the first shipment this spring. China’s recent purchases of U.S. corn and actions to increase access to other corn exporters is clear evidence China is now “farming-out” more of its corn production, just as it does with soybeans.![]()
- U.S. Department of Agriculture (“USDA”) confirmed China bought at least 540,000 metric tons of U.S. corn via daily sales in early July. China’s appetite for U.S. corn may exceed analysts estimates. Several China-based sources signal the country has bought at least 5 million metric tons (“MMT”) of corn since March and could buy at least 10 MMT of corn in 2011-12. China’s continued strong appetite for U.S. corn, especially on sharp price breaks, suggests an underlying demand for corn market may support the strong crop season.
- July 11th: China Grain Reserves Corp (Sinograin) has recently bought over 1 MMT of U.S. new-crop corn. (Source: Reuters). It is believed that purchases totalled 23 cargoes (approximately 1.38 MMT).
- Chinese 2013/2014 wheat imports are expected to rise 73% from last year to 5 MMT, according to the state-run China National Grain and Oils Information Center (“CNGOIC”). Chinese Domestic production has been hurt by poor weather and imports are up from the CNGOIC’s previous forecast of 3.5 MMT.
For shipowners, the shift in demand and the expansion of productions sources is significant.
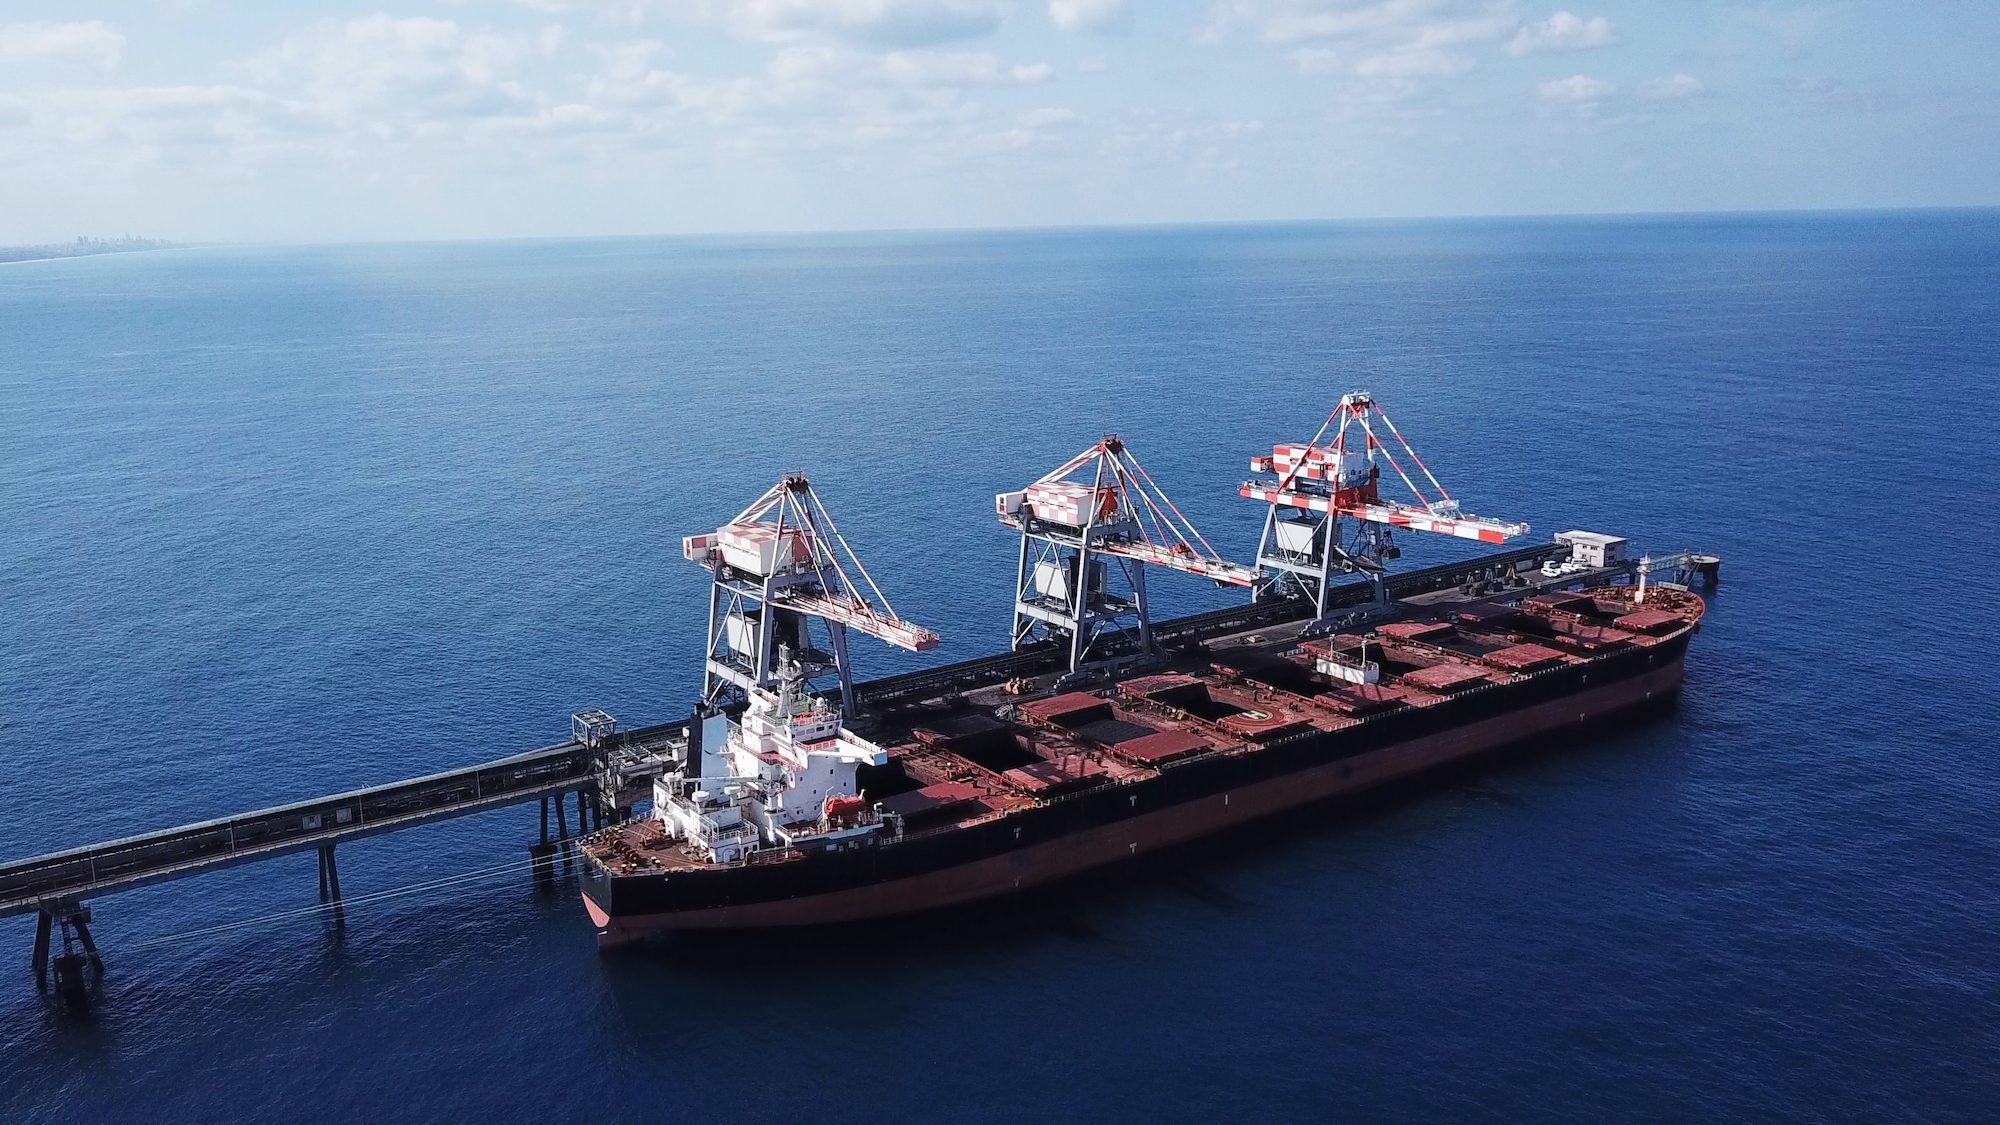
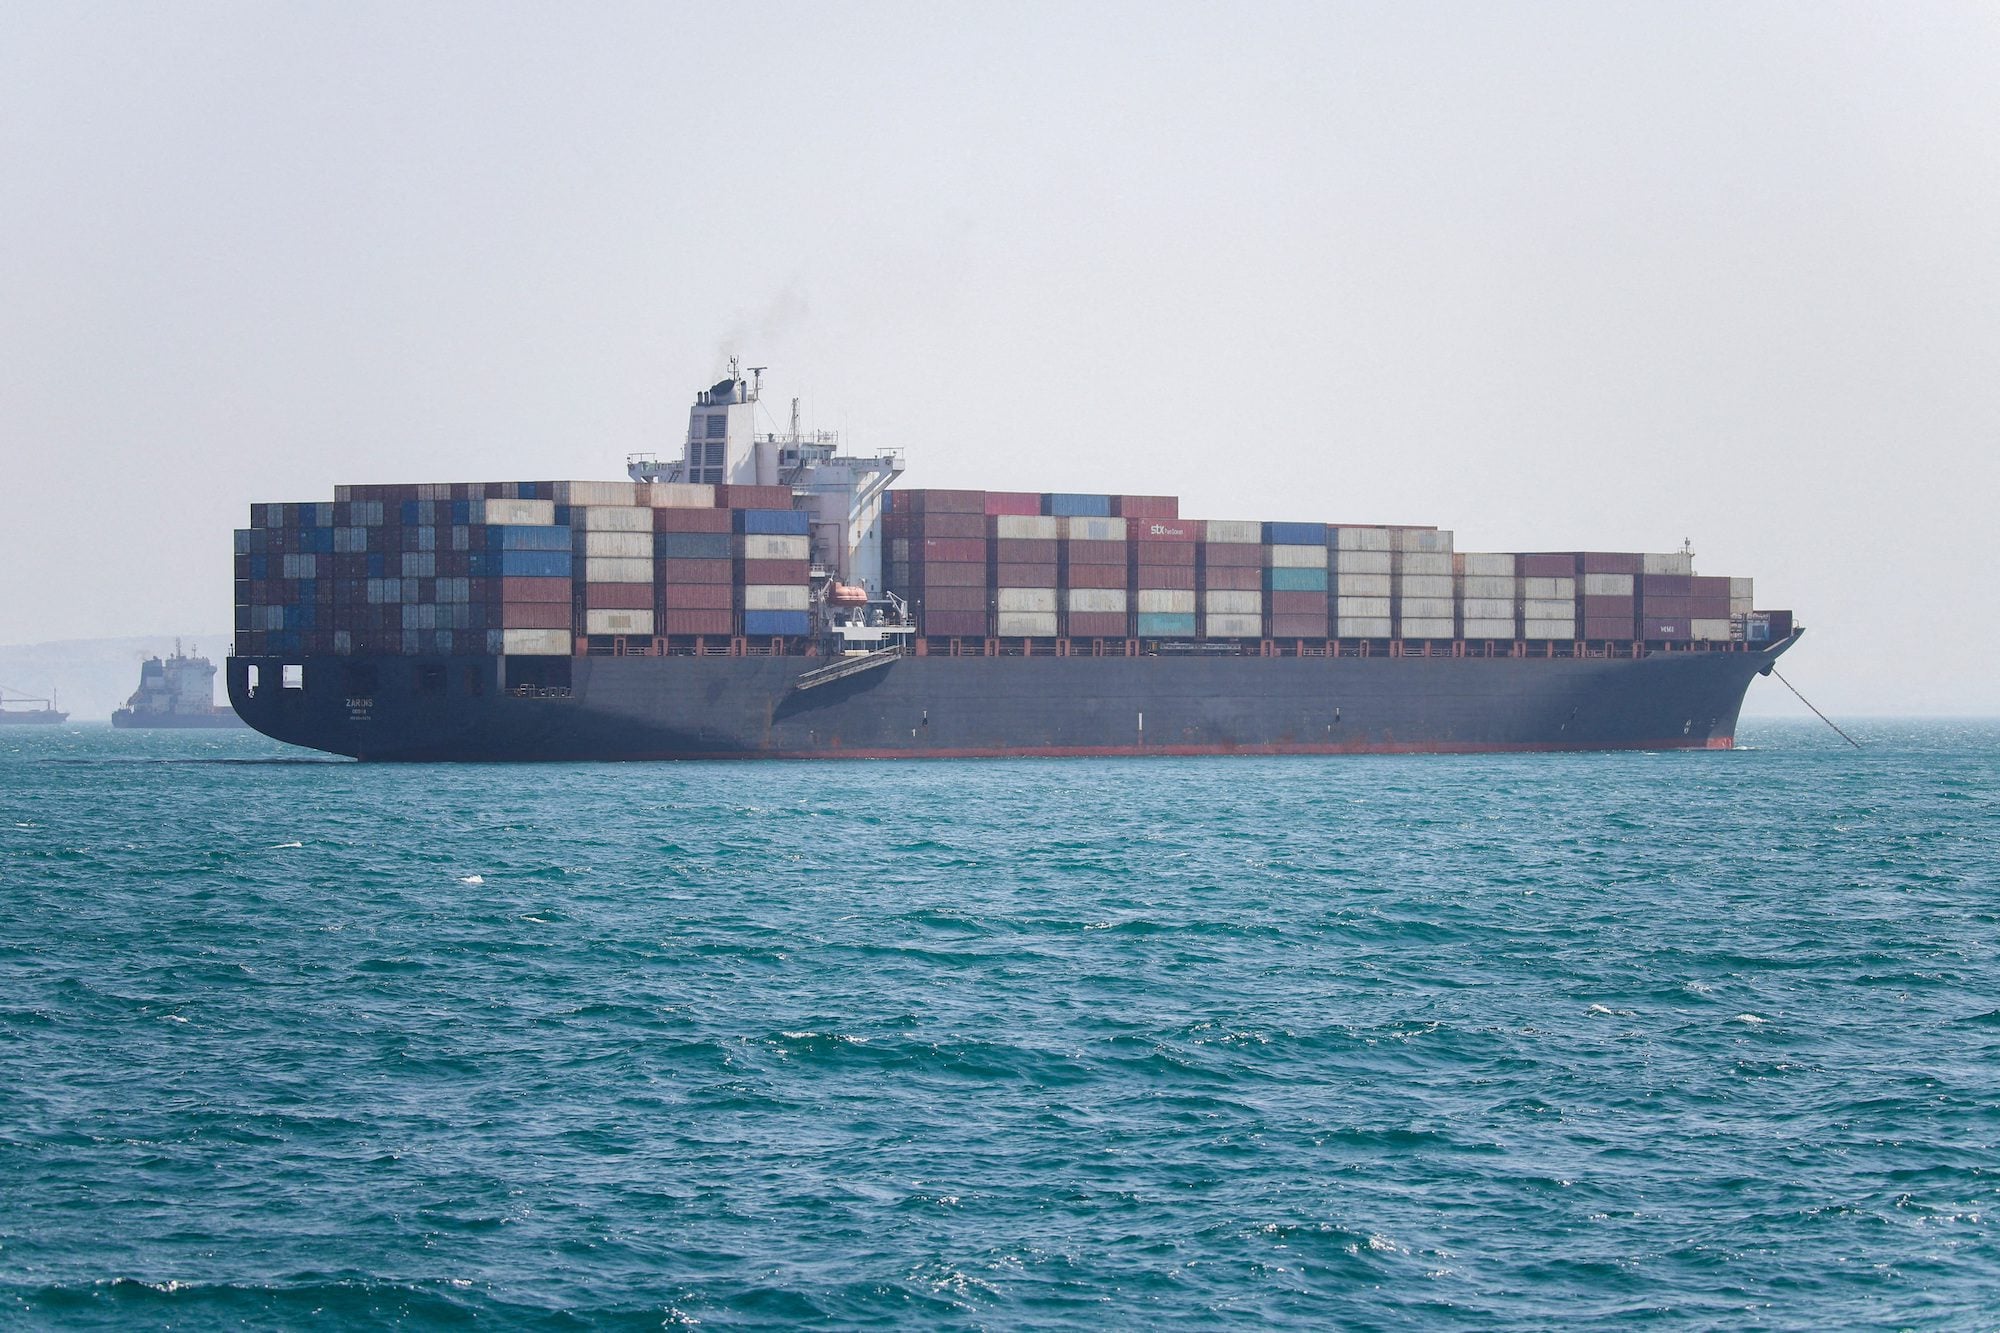
Capesize vessels, the mainstay for the transportation of industrial commodities such as coal and iron ore, which have seen fleet growth to explode, may not expect the same type of growth in demand from from China or the increase in capacity (mines) to support the size of the fleet. Panamax carriers should expect to experience an increase in demand to transport grains. It can be expected that over the course of the next 4 to 5 years (at least) such a market imbalance should cause Capesize vessels trade down into Panamax markets and constantly pressure shipping rates. The expected imbalances will not be sorted until the Capesize and Panamax fleets align with demand for agricultural and industrial commodities.