Don’t Miss Your Daily Briefing for the Maritime Industry
Join the leading maritime news network
— trusted by our 106,969 members
Stacked containers are shown as ships unload their cargo at the Port of Los Angeles in Los Angeles, California, U.S. November 22, 2021. REUTERS/Mike Blake/File Photo
A Key Freight Indicator Is Flashing Red — Here’s What It Means for Global Trade
By Lori Ann LaRocco – A key supply chain data point is flashing red, warning that the pullback in freight orders will continue.
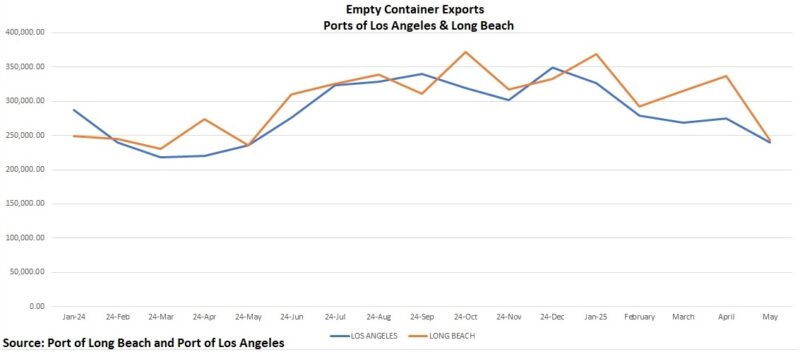
Empty container exports is a forward-looking indicator of demand. After the Geneva talks between the US and China, there were many predictions of a surge in containers during peak season, but after a brief pop, trade data is indicating this will not happen.
The relationship between trade datasets can help peel away any uncertainty in terms of supply and demand. Ocean freight orders increased moderately but quickly pulled back. The data point which feeds into ocean freight orders is empty container exports.
Why? Because the movement of empties is an indicator of demand. This chart highlighting the empty containers leaving the ports of Los Angeles and Long Beach shows there is no rush for empties to go back to be refilled. You can see the surge in empty containers during the pandemic when empties were a priority to get back to Asia so they could be refilled and returned to the United States.
While yes, there have been a lot of blank sailings which can lead to empties lingering at the port, the fact is the blank sailings are continuing throughout the summer. If there was a rush of incoming orders, ocean carriers would deploy additional vessels.
Maritime Information Specialists for the Marine Exchange of Southern California & Vessel Traffic Service Los Angeles and Long Beach San Pedro, CA have reported 49 container ship “blank sailings” will skip the ports of Los Angeles or Long Beach through August first. That’s 2 more than last week.
The trickle-down impact of the reduction in ocean freight will filter through the pipes of trade — specifically trucks, rails, and warehouses. Competition for that coveted container will heat up. You are seeing this competition unfold in terms of services or features. To help generate trade stickiness, a slew of tariff and Customs tools have been recently deployed.
The negative impact of the container crunch is already being felt in labor. For the second month in a row, Port of Los Angeles executive director Gene Seroka has warned about the impact the decrease in containers is having on labor.
“For every two longshore members that walked into the hiring hall, one went home without work,” said Seroka.
The Port of Los Angeles processed 717,000 container units for the month of May, about 5% less than last year at this time. Imports fell by 9% from last year and 19% compared to the month of April. Inbound cargo totaled 356,020 TEUs, which was 25% less than what was forecasted on April first before the tariffs were announced.
“For context, we typically expect May volume to be a little stronger than that of April because we’re approaching peak season, and compared to our five-year running average for the month of May, imports are down 17%,” said Seroka.
Until the China tariffs come down to a level where they are not breaking the bank of US importers and trade deals are inked and official, the flow of trade will resemble more of a drip line versus an open spigot.
The Port of Los Angeles reported its best single month in its history. In a media briefing, port executive director Gene Seroka announced the port processed 1,042,652 TEUs, 23k TEUs more than the July 2025 record.
U.S. container imports are finally beginning to slow after an unusually long peak shipping season that stretched through the summer and into early fall, according to the latest Global Port Tracker report from the National Retail Federation (NRF) and Hackett Associates. The slowdown comes after months of stronger-than-expected cargo volumes at major U.S. ports, as retailers continued bringing in merchandise despite tariffs, inflation and higher transportation costs. Ports covered by Global Port Tracker handled 2.3 million twenty-foot equivalent units (TEUs) in August, up 0.4% from July but down 0.7% from a year earlier. August now appears to have been the busiest month of 2026, marking a shift from last month’s forecast that September would take the top spot. “Even with any fluctuations in final data, we’re likely past the busiest part of the year,” said Jonathan Gold, NRF vice president for supply chain and customs policy. “The truth is that the peak season started early and was stretched out through the summer and early fall, with the difference from month to month often amounting to little more than a rounding error,” Gold said. The latest forecast puts September imports at 2.28 million TEUs, down from the 2.31 million TEUs projected a month ago. October is expected to ease further to 2.25 million TEUs before volumes fall to 2 million TEUs in November. Despite the expected slowdown, imports are still running well ahead of last year in some months. September volumes are forecast to rise 8.2% year over year, followed by an 8.5% increase in October. The revised outlook follows a peak season that has repeatedly defied expectations. Retailers moved merchandise into the country earlier this year to get ahead of tariff changes and supply chain uncertainty, initially raising expectations that imports would peak early and decline through the summer. Instead, volumes remained elevated, with shipping delays and resilient consumer demand helping extend the traditional peak season. The strength has been evident at individual ports. The Port of Los Angeles recorded its busiest three-month stretch on record during June, July and August, while the Port of Savannah reported a record September earlier this week, handling 504,015 TEUs, up 3.7% from a year earlier. Hackett Associates founder Ben Hackett said the economic outlook remains mixed, with consumers continuing to spend despite signs of weakening confidence. “Despite this, consumers appear to remain confident and cautious at the same time, with consumer confidence indexes sliding to multi-year lows while consumer spending continues to be robust in the face of increasing inflation,” Hackett said. For the full year, Global Port Tracker now expects imports at major U.S. container ports to reach 25.8 million TEUs, up 1.4% from 25.4 million TEUs in 2025. That is slightly above last month’s forecast of 25.7 million TEUs. Looking ahead, January 2027 imports are forecast at 2.07 million TEUs, down 1.9% year over year, followed by 1.92 million TEUs in February, up 1%. For retailers, the extended shipping season means much of the merchandise needed for the holidays is already in the country, reducing the need for another major import surge before year-end. “Most holiday merchandise has arrived, and the remainder of the year is just a matter of last-minute replenishment and preparation for early 2027,” Gold said.
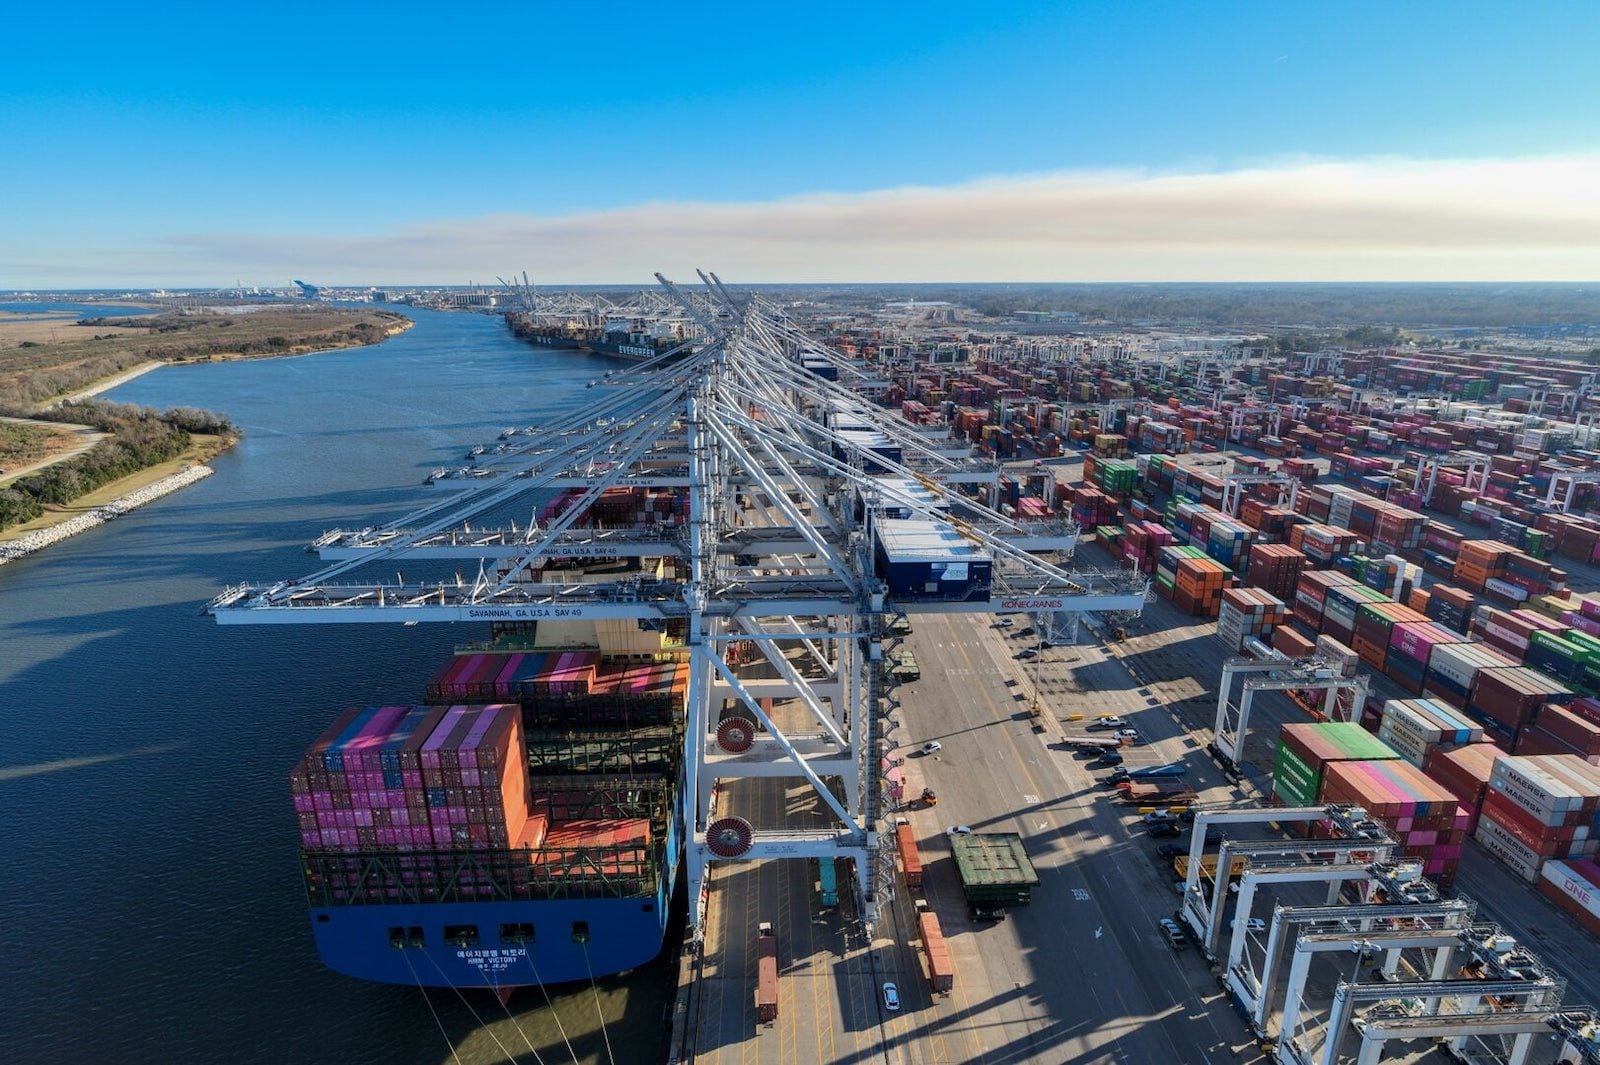
The Port of Savannah handled a record 504,015 twenty-foot equivalent units in September, up 3.7% from a year earlier as strong imports and a later-than-usual peak season boosted volumes.
October 7, 2026
Total Views: 611
Get The Industry’s Go-To News
Subscribe to gCaptain Daily and stay informed with the latest global maritime and offshore news
— just like 106,969 professionals
Secure Your Spot
on the gCaptain Crew
Stay informed with the latest maritime and offshore news, delivered daily straight to your inbox
— trusted by our 106,969 members
Your Gateway to the Maritime World!
Essential news coupled with the finest maritime content sourced from across the globe.

 Join The Club