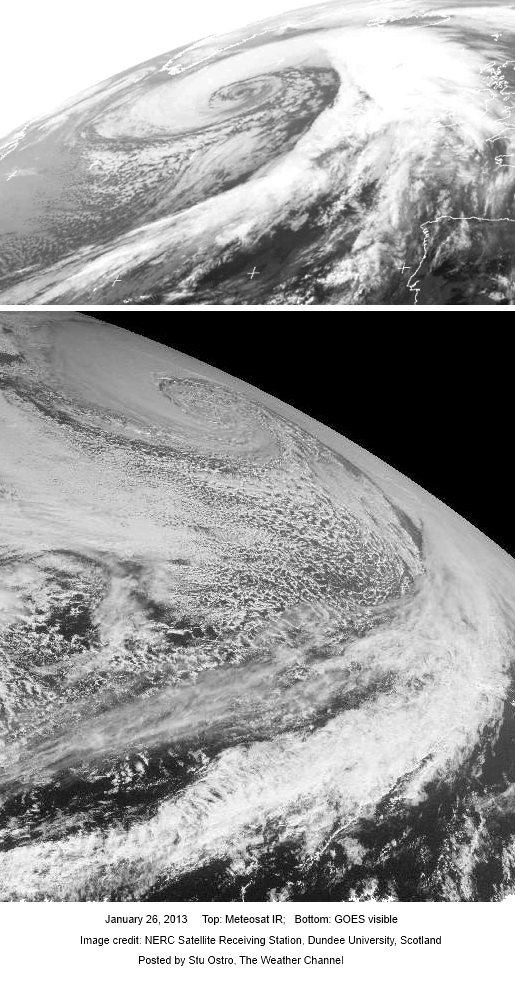
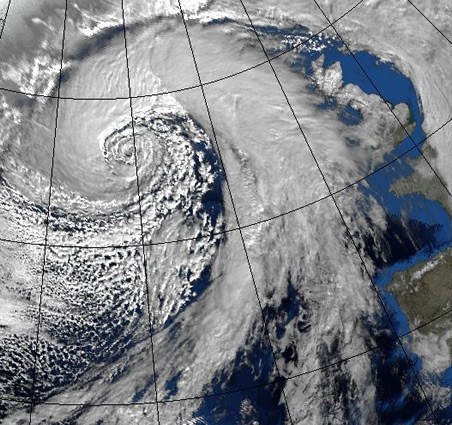
NOAA IR Satellite 1145Z 26 January 2013 showing 930 mb hurricane force storm.
Last weekend saw an unusually intense hurricane force extratropical storm low over the North Atlantic. An active weather pattern started showing up on computer models more than a week earlier and by the 21st, the official NOAA “96 hour North Atlantic surface forecast chart” showed a rapidly deepening 977mb storm low over the central North Atlantic for 12Z Friday January 25th moving northeastward with a forecasted central pressure dropping to 933mb by 12Z on Saturday the 26th!
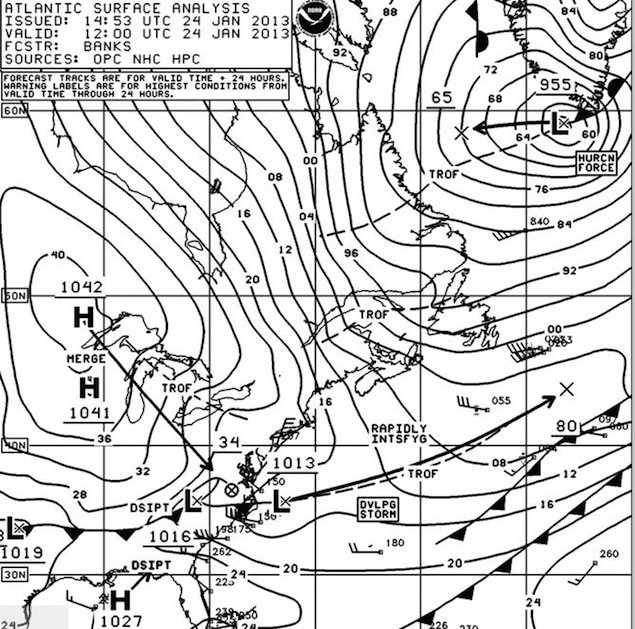
NOAA OPC Surface Analysis 12Z 24 January 2013 showing fast moving low passing off the coast.
This particular system began as a weak 1023 mb disturbance along an Arctic front that was moving south and east across the Central US on the afternoon of the 23rd.
By Thursday, the 24th the rapidly moving disturbance had passed off the Middle Atlantic coast and had deepened to 1013mb. By Thursday night it was becoming apparent that this storm could approach historic strength during the following 72 hours and the official NOAA forecasts predicted that this storm would deepen to near 977mb by 12Z Friday (Jan. 25th) and as low as 920 or 924 mb by 12Z Saturday with hurricane force winds up to 75-80 knots possible.
NOAA OPC Surface Forecast 12Z 25 January 2013 showing developing hurricane force storm
Once off the coast the developing disturbance moved very rapidly (at nearly 50kts) towards the east-northeast deepening quickly to 984mb by 12Z Friday.
NOAA OPC 500MB Analysis 12Z 25 January 2013 showing strong winds high above the sea surface.
The stage was set for very rapid (explosive) deepening and over the next 24 hours the central pressure of this now large hurricane force storm dropped 54 mb to 930mb!
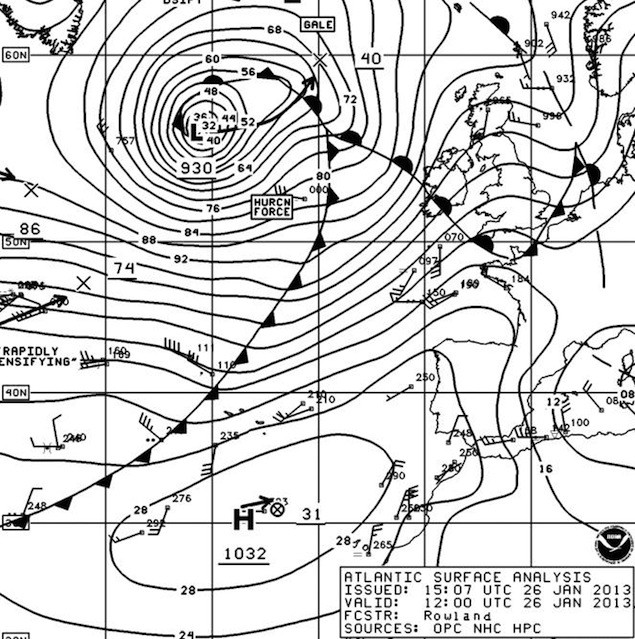
NOAA OPC Surface Analysis 12Z 26 January 2013 showing 930 mb hurricane force storm low.
This generated huge waves of up to 18 meters (59 feet) as depicted on the NOAA OPC Sea State Analysis on the 26th. Wave heights on the NOAA chart here are significant wave heights which are defined as the average of the 1/3 highest waves. This means that there was a 1 in 10 chance for a wave of almost 23 meters (75 ft.) and a 1 in 100 chance that a wave could have been as high as 30 meters (98 ft.).
NOAA OPC Wave Analysis 12Z 26 January 2013 showing significant wave heights to 17 meters (59 ft.)
Although this was a very intense storm, it was not a record. The all-time record for North Atlantic extratropical storms was the Braer Storm of January 1993 that reached a min pressure of 914 mb (26.99 in Hg) on January 10th. The 1993 storm caused blizzard conditions across much of Scotland and also led to the final breakup of the oil tanker MV Braer, which had been stranded in rocks off the Shetland Islands by a previous storm.
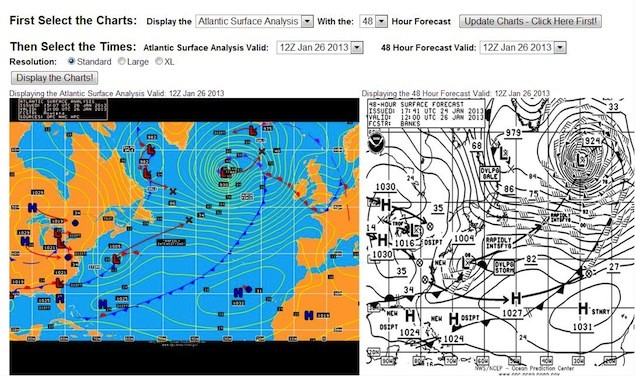
NOAA OPC has a web page where you can verify how good or bad their graphical forecasts were. For this storm the NOAA OPC 48 hour forecast was for 924mb min pressure at 12Z on the 26th which turned out to be a bit too aggressive as the actual storm verified at 930mb. Given that this was a system at the very deep end of the pool, the forecast was not too far off.
Verification NOAA OPC Jan 26th showing the 48 hour forecast chart and the actual analysis chart
A drill ship broke its moorings at a terminal in southwest Scotland on Tuesday night and drifted into a channel before its crew was able to drop anchor and restore...
Editor’s NOTE: With Hurricane Sandy currently over Cuba and threatening Florida and the U.S. East Coast, here is a look at some of the top websites for tracking hurricanes as picked...
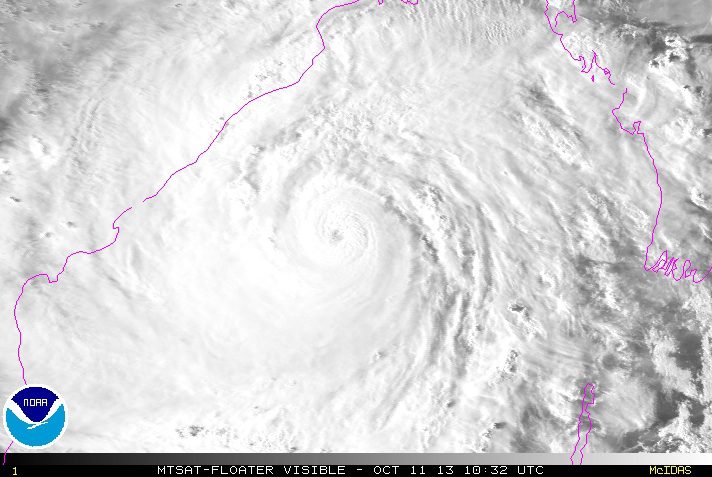
Tens of thousands fled their homes in coastal areas of eastern India and moved to shelters on Friday, bracing for the fiercest cyclone to threaten the country since a devastating storm killed 10,000 people 14 years ago.
October 11, 2013
Total Views: 45
Get The Industry’s Go-To News
Subscribe to gCaptain Daily and stay informed with the latest global maritime and offshore news
— just like 104,922 professionals
Secure Your Spot
on the gCaptain Crew
Stay informed with the latest maritime and offshore news, delivered daily straight to your inbox
— trusted by our 104,922 members
Your Gateway to the Maritime World!
Essential news coupled with the finest maritime content sourced from across the globe.

 Join The Club


![BOOM! Intense North Atlantic Storm Drops to 930 Millibars! [REVIEW]](https://gcaptain.com/wp-content/uploads/2013/01/NOAA-OPC-Surface-Forecast-12Z-25-January-20133.jpeg)

![Top Hurricane Tracking Sites [Ranked]](https://gcaptain.com/wp-content/uploads/2012/08/699900main_sandy_360.jpeg)