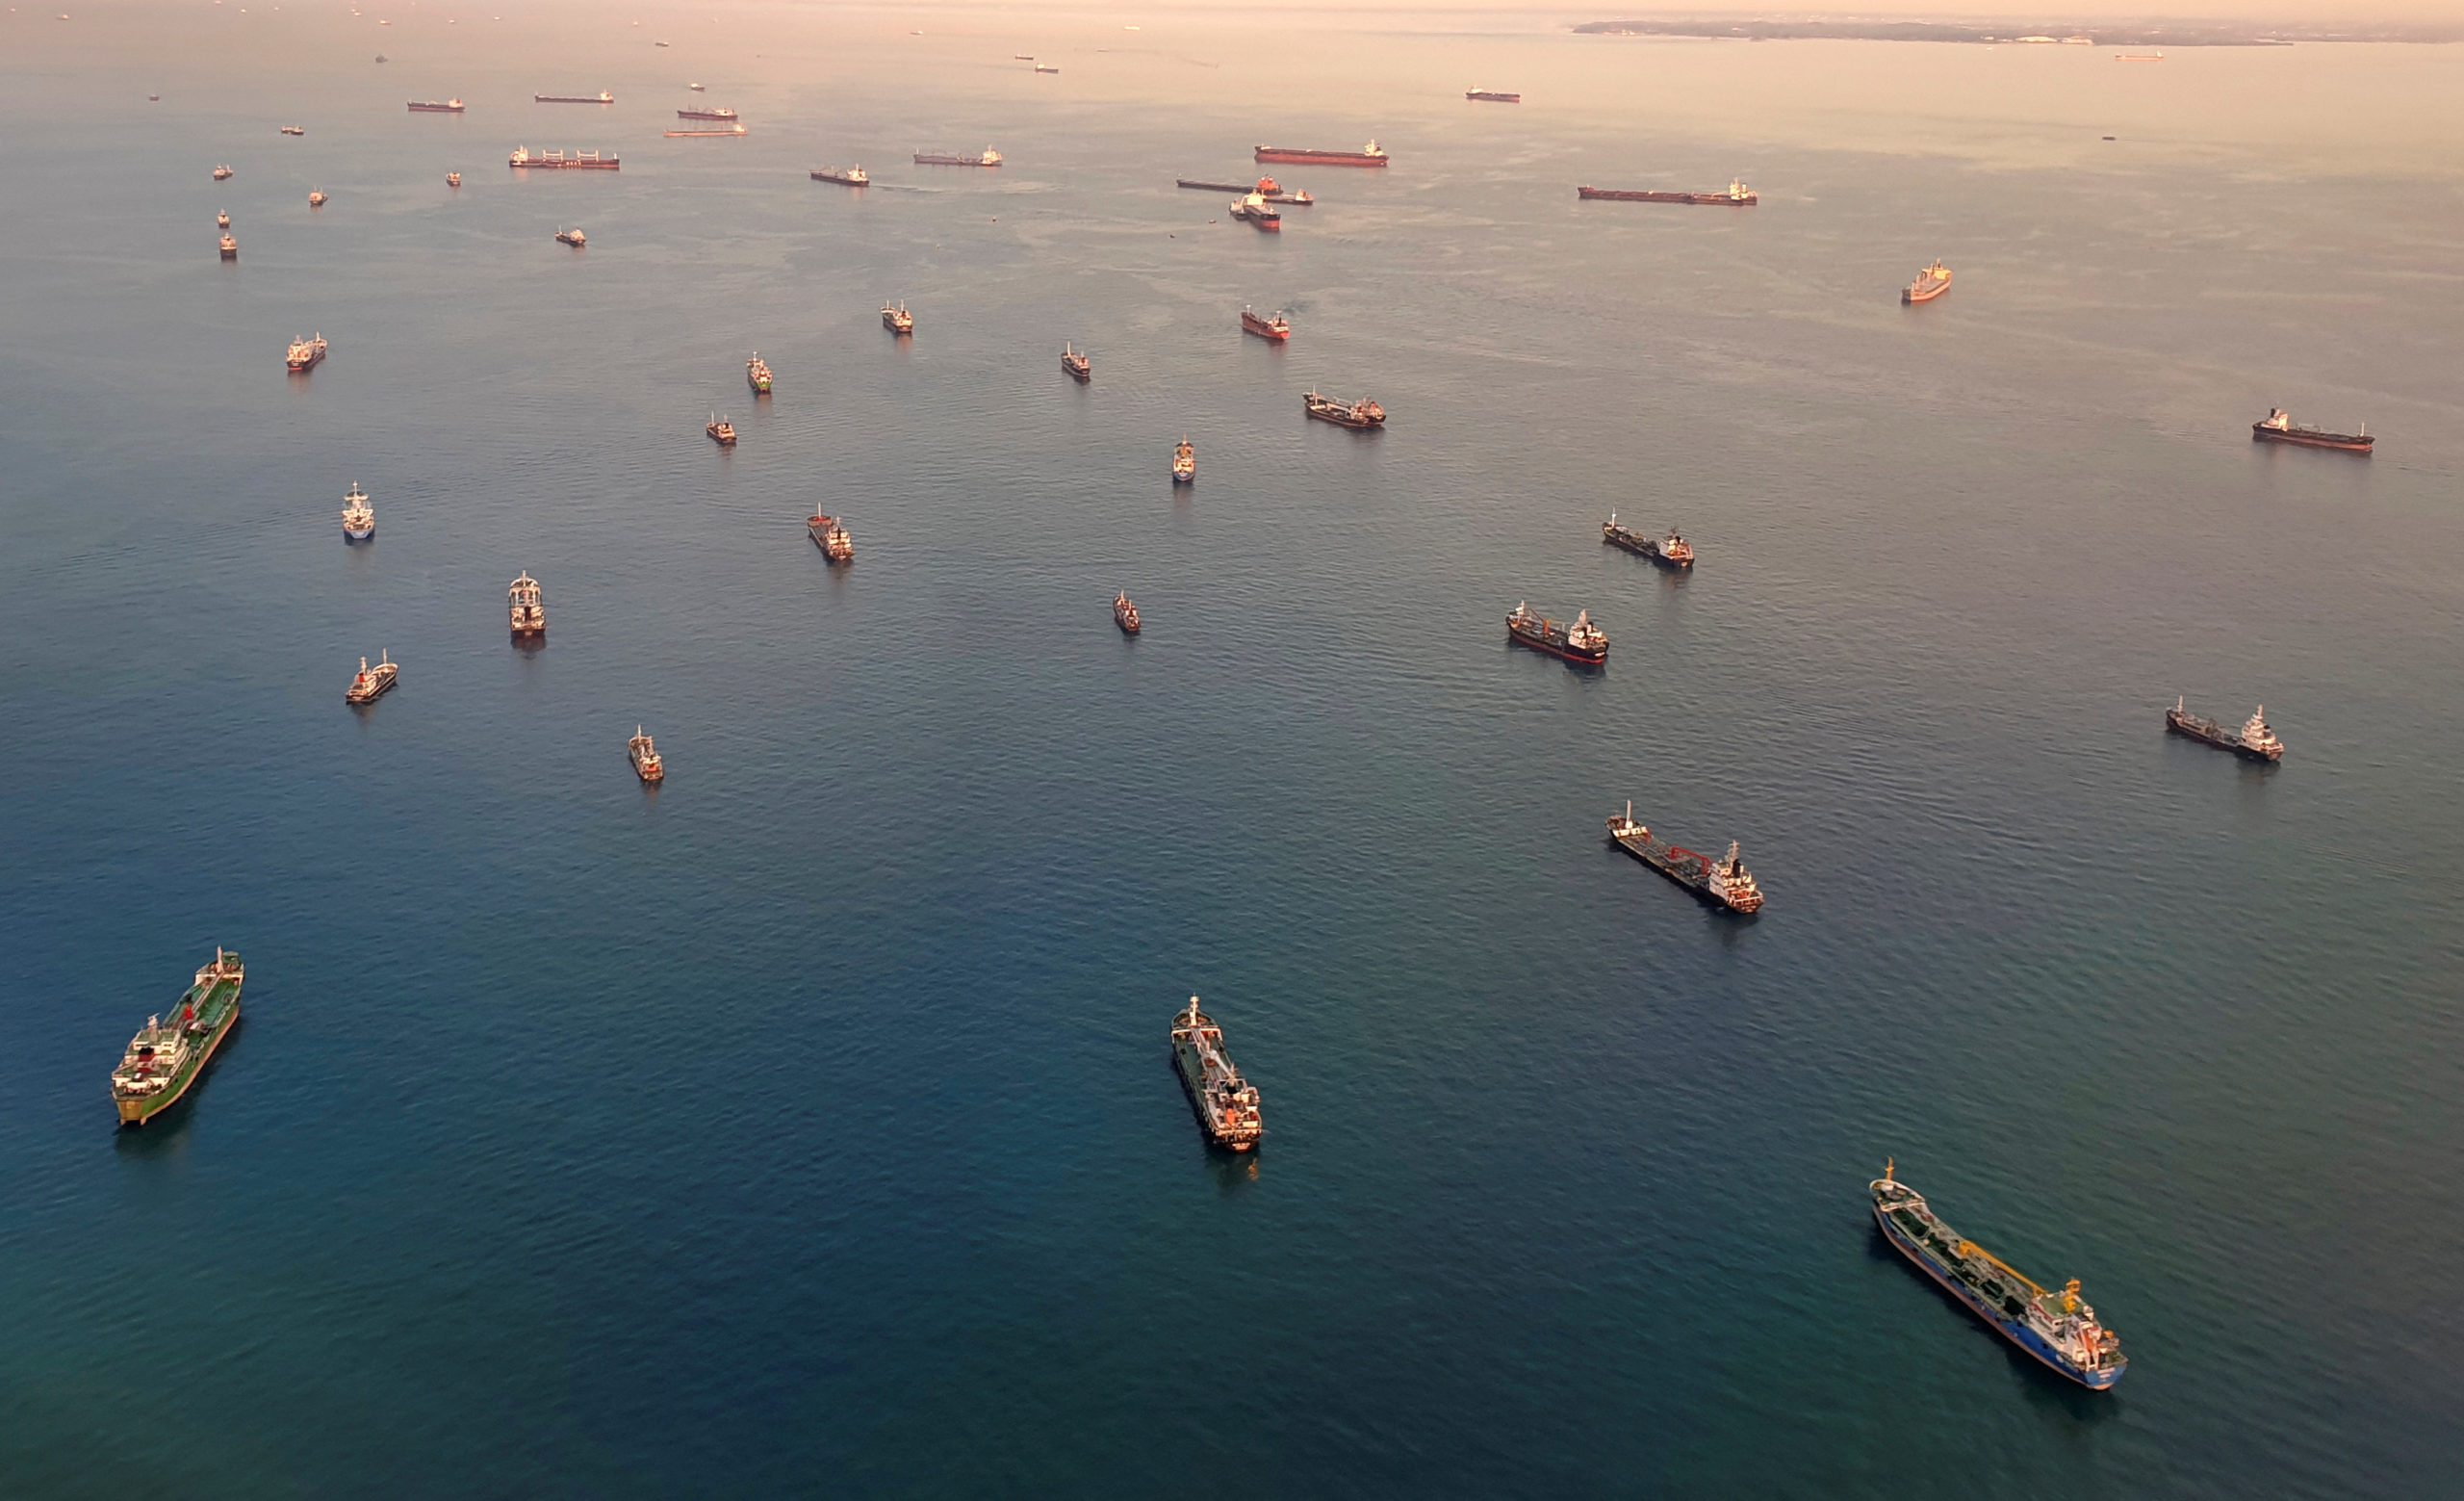
SINGAPORE, June 14 (Reuters) – Monthly sales of marine fuel, also known as bunker fuel, hit over five-year highs at the world’s largest refuelling hub Singapore in May as vessel arrivals spiked amid firm container throughput, official data showed on Wednesday.
Singapore’s bunker sales are an indicator of sentiment at one of the world’s major ports and demand also affects fuel oil refining margins in Asia.
Sales extended gains for a third consecutive month to 4.52 million tonnes, up 6.2% month-on-month, Singapore’s Maritime and Port Authority data showed.
The monthly sales figures were last higher in January 2018 at 4.61 million tonnes, historical data showed.
The uptick reflected higher vessel calls for bunkering, which totalled 3,631 calls in April, extending gains for a third straight month.
“Both container and bulker arrivals by gross tonnage are at their highest since 2010. There is also a sharp jump of container ships going to China in May,” said Yaw Yan Chong, director of Refinitiv Oil Research in Asia.
“We believe that much of the record high container arrivals are en-route to China after taking bunkers here,” Yaw added.
Bunker prices remained more competitive at Singapore in May compared to other regional ports in Asia, which drew more ships to refuel at Singapore in recent months, trade sources said.
“Singapore VLSFO prices were more competitive versus Zhoushan in May and continue to be cheaper than Zhoushan in June to-date,” said Ivan Mathews, FGE’s head of Asia refining and global fuel Oil services.
That said, the tighter VLSFO situation in Singapore could narrow the discount versus Zhoushan and slightly pressurise VLSFO sales this month, Mathews added.
Sales of low sulphur fuel oil grades totalled 2.73 million tonnes in May, climbing 1% from April, calculations based on the MPA data showed.
Meanwhile, sales of high sulphur fuel oil grades rose 18% from April to 1.40 million tonnes in May, while marine gasoil sales rose 4% month-on-month at 340,400 tonnes.
Some bunker traders were surprised by the data, saying that the volumes turned out to be stronger than expected.
“We did not see that big jump (in volumes) on our end, although demand was definitely not less than April,” a senior bunker fuel trader in Singapore said.
Singapore bunker sales and bunker vessel calls by month:
Month
Total Sales (‘000 tonnes)
M-o-M
Y-o-Y
Vessel Arrivals (for bunkering)
M-o-M
Y-o-Y
Jan-22
4,033.40
-3.5%
-10.4%
3,115
-0.90%
-13.3%
Feb-22
3,501.60
-13.2%
-15.0%
2,805
-10.00%
-13.4%
Mar-22
3,770.10
7.7%
-10.2%
3,020
7.70%
-12.7%
Apr-22
3,742.30
-0.7%
-12.1%
3,025
0.20%
-12.5%
May-22
4,115.50
10.0%
1.1%
3,168
4.70%
-5.4%
Jun-22
3,754.10
-8.8%
-8.7%
2,940
-7.20%
-9.3%
Jul-22
4,120.60
9.8%
1.4%
3,181
8.20%
-3.4%
Aug-22
4,116.30
-0.1%
1.1%
3,212
1.00%
0.7%
Sep-22
3,967.60
-3.6%
0.8%
3,155
-1.80%
1.8%
Oct-22
4,251.00
7.1%
-0.1%
3,431
8.70%
8.4%
Nov-22
4,372.70
2.9%
3.6%
3,299
-3.80%
2.7%
Dec-22
4,214.90
-3.6%
0.9%
3,311
0.40%
5.3%
Jan-23
4,376.90
3.8%
8.5%
3,447
4.10%
10.7%
Feb-23
3,794.30
-13.3%
8.4%
3,063
-11.10%
9.2%
Mar-23
4,175.30
10.0%
10.7%
3,476
13.50%
15.1%
Apr-23
4,253.50
1.9%
13.7%
3,495
0.50%
15.5%
May-23*
4,518.30
6.2%
9.8%
3,631
3.90%
14.6%
Monthly bunker sales by grade in ‘000 tonnes:
Month
LSFO 100 cst
LSFO 180 cst
LSFO 380 cst
MFO 180 cst
MFO 380 cst
MFO 500 cst
MGO
LSMGO
Others
Jan-22
460.10
93.00
2007.90
0.10
1036.70
85.60
13.80
336.10
0.00
Feb-22
459.60
93.80
1733.10
0.20
795.90
128.10
10.60
280.50
0.00
Mar-22
555.10
100.60
1741.70
0.00
962.60
124.90
9.70
271.80
3.70
Apr-22
533.00
111.60
1832.60
0.00
914.50
27.20
7.90
278.60
36.70
May-22
540.20
103.30
1995.60
0.00
999.90
72.30
5.80
375.80
22.60
Jun-22
382.10
90.40
1881.00
0.00
1045.90
47.40
6.90
272.70
27.60
Jul-22
439.10
57.30
2009.10
0.00
1255.30
12.00
13.70
313.80
20.30
Aug-22
397.10
53.90
2059.50
0.00
1227.50
2.90
11.30
330.40
32.60
Sep-22
461.20
67.90
1944.40
0.00
1114.20
1.30
6.30
329.40
42.80
Oct-22
363.70
68.40
2154.30
0.00
1309.70
1.60
11.10
305.10
37.10
Nov-22
697.60
61.20
1992.90
0.00
1237.20
12.20
22.80
307.80
40.90
Dec-22
372.30
73.70
2150.30
0.00
1265.80
0.00
20.60
285.60
46.60
Jan-23
429.40
73.60
2298.30
0.00
1226.10
0.00
10.80
313.70
25.00
Feb-23
346.44
63.47
1938.52
0.00
1105.58
3.69
6.21
297.02
33.41
Mar-23
539.10
75.10
1960.50
0.10
1235.20
0.50
14.70
315.50
32.20
Apr-23
589.60
82.10
2033.50
0.00
1164.80
21.70
15.30
312.10
33.30
May-23*
454.50
73.70
2204.10
0.40
1367.70
30.90
27.50
312.90
46.60
(Data from Maritime and Port Authority of Singapore)
(Reporting by Jeslyn Lerh; Editing by Shailesh Kuber)
Singapore and Indonesia used last week’s Leaders’ Retreat in Jakarta to put their names to a Memorandum of Understanding on carbon credits collaboration, a step that has been widely, and...
Indonesia and Singapore pledged anew to keep the Strait of Malacca open as Middle East tensions reignite concerns about the freedom of navigation in the world’s most important waterways.
A widening conflict in the Middle East has led to dramatic swings and surges in the price of fuel for ships, prompting distributors in Singapore, the world’s top bunkering hub, to cut back their purchases.
March 17, 2026
Total Views: 1177
Get The Industry’s Go-To News
Subscribe to gCaptain Daily and stay informed with the latest global maritime and offshore news
— just like 104,525 professionals
Secure Your Spot
on the gCaptain Crew
Stay informed with the latest maritime and offshore news, delivered daily straight to your inbox
— trusted by our 104,525 members
Your Gateway to the Maritime World!
Essential news coupled with the finest maritime content sourced from across the globe.

 Join The Club