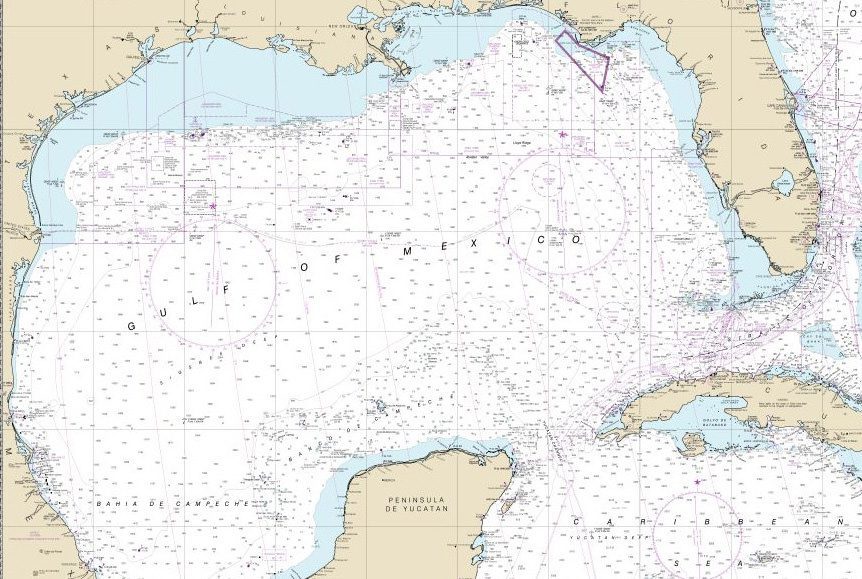
NOAA scientists are forecasting this summer’s Gulf of Mexico hypoxic area or “dead zone” — an area of low to no oxygen that can kill fish and other marine life — to be approximately 4,880 square miles. The 2021 forecasted area is smaller than, but close to the five-year average measured size of 5,400 square miles.
This forecasted size is also substantially less than the 8,776-square-mile 2017 Gulf hypoxic zone, which was the largest zone measured since mapping began in 1985. The annual prediction is based on a suite of models that incorporate U.S. Geological Survey (USGS) river-flow and nutrient data.
“Understanding the effects of hypoxia on valuable Gulf of Mexico resources has been a long-term focus of NOAA’s research,” said Nicole LeBoeuf, acting director of NOAA’s National Ocean Service. “These forecasting models inform us of the potential magnitude of the Gulf of Mexico hypoxic zone that might impact living marine resources and coastal economies.”
The annual Gulf of Mexico dead zone is primarily caused by excess nutrient pollution from human activities in urban and agricultural areas throughout the Mississippi River watershed. When the excess nutrients reach the Gulf, they stimulate an overgrowth of algae, which eventually die and decompose, depleting oxygen as they sink to the bottom. The resulting low oxygen levels near the bottom of the Gulf cannot support most marine life. Fish, shrimp and crabs often swim out of the area, but animals that are unable to swim or move away are stressed or killed by the low oxygen. The Gulf of Mexico dead zone occurs every summer.
River discharge in May and the associated nutrient load to the Gulf of Mexico has been shown offsite link to be a major contributing factor to the size of the dead zone which forms each summer. In May 2021, discharge in the Mississippi and Atchafalaya rivers was about 2% below the long-term average between 1980 and 2020. The USGS estimates that this smaller-than-average river discharge carried 90,500 metric tons of nitrate and 15,600 metric tons of phosphorus into the Gulf of Mexico in May alone. These nitrate loads were about 32% below the long-term average, and phosphorus loads were about 9% below the long-term average.
The USGS operates more than 3,000 real-time stream gauges, 60 real-time nitrate sensors, and 38 long-term monitoring sites to measure nutrients in rivers throughout the Mississippi-Atchafalaya watershed. Data from these networks are used to track long-term changes in nutrient inputs to the Gulf and to help build models of nutrient sources and hotspots within the watershed.
While the forecast assumes typical weather conditions, the measured dead zone size could be disrupted by major weather events, such as hurricanes and tropical storms, which mix ocean waters, as occurred in 2018, 2019 and 2020. A NOAA-supported monitoring survey, scheduled for later this summer, will confirm the size of the 2021 dead zone and is a key test of the accuracy of NOAA’s models.
NOAA and its partners continue to develop additional hypoxia forecast capabilities to understand impacts on living marine resources and how combining multiple modeling approaches can better predict the hypoxic zone.
Editorial Standards · Corrections · About gCaptain

 Join The Club