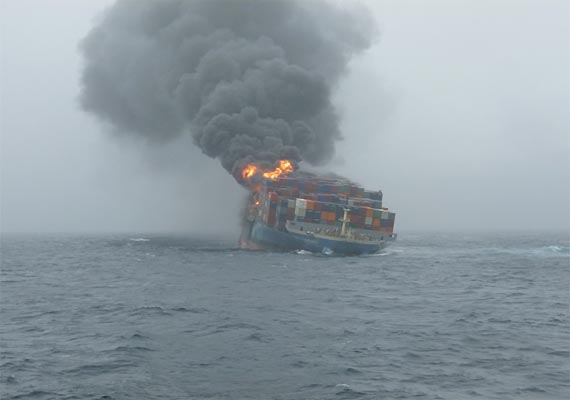
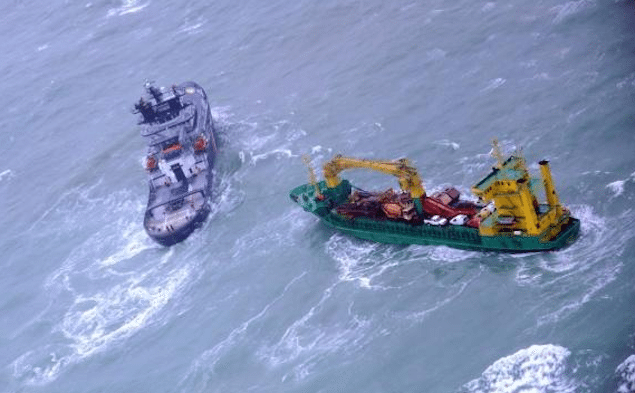
MOL Comfort on fire in the Indian Ocean in July 2013.
Global marine insurance provider Allianz Global Corporate & Specialty has released its second annual Safety and Shipping Review 2014, analyzing trends of reported shipping losses for vessels over 100 gross tons during 2013.
Among other elements, the report digs into vessel losses and casualties over the past year and provides a good comparison of how 2013 stacked up against data going back to 2002, which of course makes for some interesting reading.
Here’s a list of five interesting facts about maritime shipping losses and casualties as identified by the report:
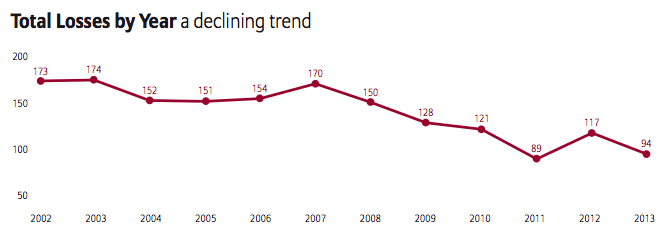
1. Losses Declining
Graph courtesy AGCS
A total of 94 large ships (over 100 gross tons) were reported total losses in 2013, down 20% compared to 2012 when 117 ships were lost. The 2013 annual total is actually only the second time in the last 12 years that the total ships lost dropped below 100.
The 2013 accident year also represents a significant improvement on the previous 10-year loss average of approximately 141, with total worldwide shipping losses having declined by 45% since 2003 when 174 vessels were lost. From 2002 thru 2013, Alliance recorded a total of 1,673 losses, or an average of 152 per year.
2. Foundering Reigns Supreme
The most common cause of losses in 2013, and for the last 12 years for that matter, was foundering. Foundering, defined in the report as sinking or submerging, actually accounted for almost three quarters (69 total or 73%) of all losses in 2013, with bad weather a significant driver. This was up from 55 losses caused by foundering in 2012 (47%) and also up from the previous 10-year average of 62, or 44%.
Coming in a not-so-close tie for second was wrecking/running aground, with 11 losses, and fire/explosion, also with 11, although both figures were down from 2012.
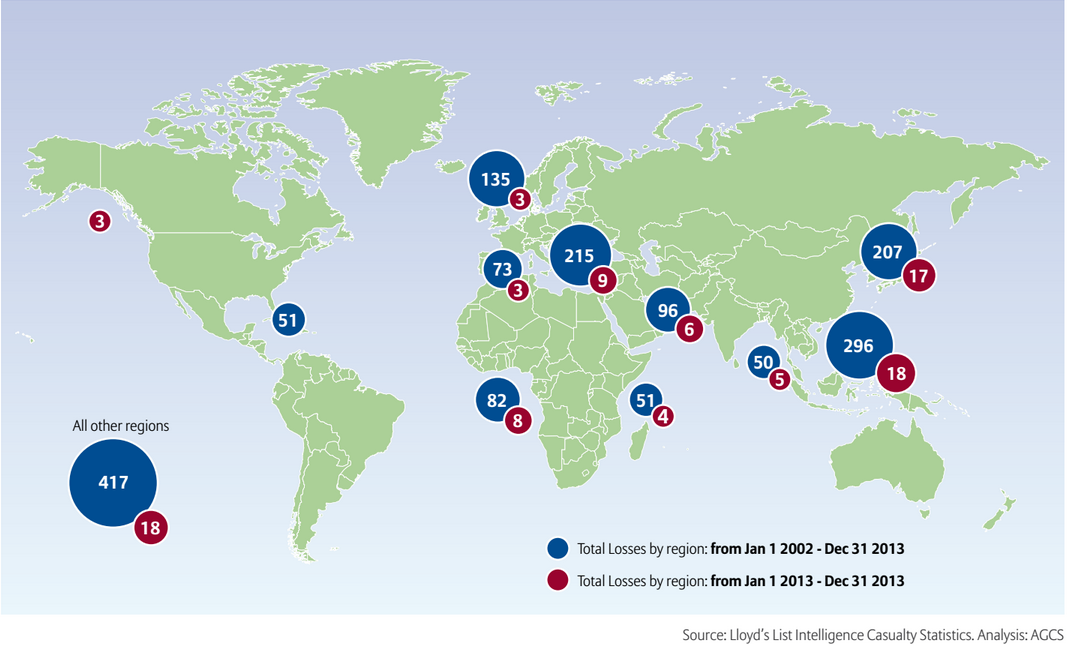
3. Location Matters
More than a third of 2013’s total losses were concentrated in two maritime regions; the region defined as South China, Indo China, Indonesia and the Philippines and also Japan, Korea and North China.
As was the case in 2012, South China, Indo China, Indonesia and Philippines region recorded the most total losses in 2013 with 18, down from 29 in 2012, while Japan, Korea, and North China came in a close 2nd with 17 total losses for the year.
For the first time, the report also tracked the total number of shipping casualties/incidents by region. The report found that in 2013, there were 2,596 vessel casualties including total losses, with the East Mediterranean and Black Sea region the top spot with 464 casualties or 18% of all incidents.
The report notes that the East Mediterranean and Black Sea in 2013 actually beat out the British Isles, North Sea, English Channel and Bay of Biscay as the region with the most number of casualties, despite it being the location of the most shipping casualties recorded since 2002. In the past 12 years, Allianz has recorded a total of 5,025 incidents in the British Isles, North Sea, English Channel and Bay of Biscay region, or nearly a fifth of the total 27,115 incidents recorded worldwide during this time.
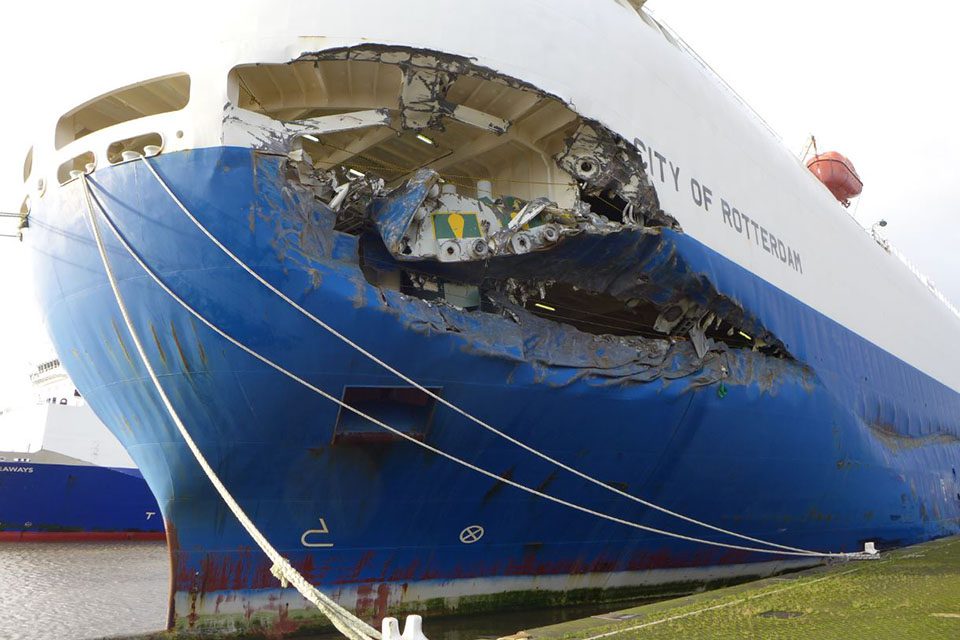
4. Cargo Ships Are Dangerous (By Comparison)
More than a third of the vessels lost in 2013 were cargo ships, with 32 lost, the report found. Coming in second was fishing vessels, with 14 lost, following by bulk carriers, with 12. Fishing vessels and bulk carriers were actually the only other two vessel types to record double-digit losses in 2013.
Since 2002, a total of 681 cargo ships have been considered as total losses, or roughly 41% of the overall tally of 1,673 losses. Combined with fishing vessels, the second most common type of ship lost, this number jumps to over 1,000 total losses, or over 60% of the overall tally since 2002.
5. Sail in June, Not January
The report found that January is the worst month for all casualties (including total losses) in the Northern Hemisphere, with 23% more losses in this month compared with the quietest month, June. In the Southern Hemisphere it is July with 41% more losses than April.
Honorable Mention:
In the Arctic, where more and more trading routes are quickly opening up, the average number of shipping casualties has increased to 45 per year between 2009 and 2013 from only seven during 2002-2007.
In addition to the shipping loss information, the report also goes on to discuss piracy and emerging risks, such as vessel size, use of LNG as a marine fuel and Arctic trading. We encourage you to read the full report for yourselves HERE.
The European Maritime Safety Agency (EMSA) has released its annual overview of marine casualties and incidents involving European-registered ships for the year 2016, showing there were 106 reported fatalities, 957...
Bremerhaven police have confirmed the death this morning of a 52 year old crane operator who was loading and unloading containers on Wednesday night from the Maersk Kerachi when one of...

 Join The Club