How do you quantify supply chain pain? Drybulk freight and containership hires (along with airfreight) are at the epicenter of all the hurt, in the view of the inventors of the newly launched Global Supply Chain Pressure Index (GSCPI).
While shipping folks have been worn down by acronym-fatigue, this new measure is worth a detailed look, since it is the product of research at the Federal Reserve Bank of New York. The team of economists at the Fed have infused two well known maritime indices (the Baltic Dry Index and the Harper Petersen index of containership hires) into the GSCPI, along with more than two dozen other economic datasets concerning manufacturing and delivery times.
The inclusion of the two maritime measures confirms what gCaptain readers already knew- that maritime transportation is integral to the functioning of the world’s economy.
The GSCPI- composed of 27 variables, has been back-cast to 1997. The objective, according to the index’s inventors, is “… to provide a more comprehensive summary of potential disruptions affecting global supply chains…built on variables that are meant to capture factors that put pressure on the global supply chain, both domestically and internationally.”
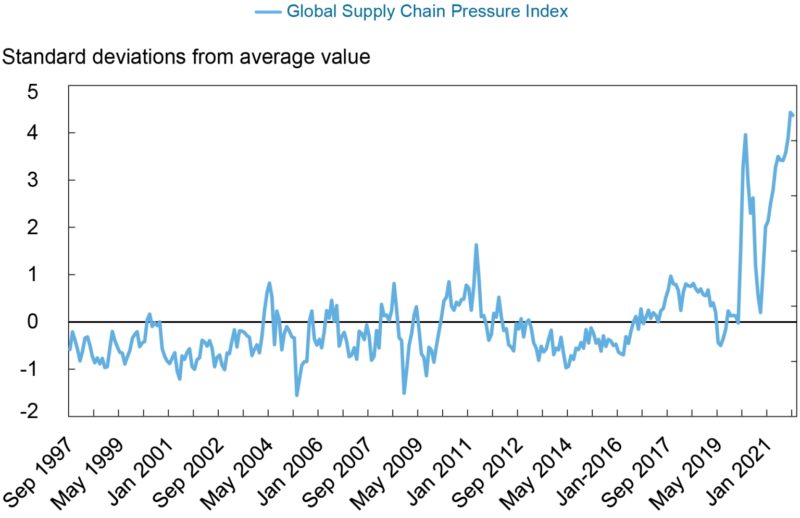
Rather than being an absolute measure (like the BDI or Harpex, which provide a sense of whether the market is “low” or “high”), the The GSCPI “…is normalized such that a zero indicates that the index is at its average value with positive values representing how many standard deviations the index is above this average value (and negative values representing the opposite).” Translated into English, this index shows aberrations from normal- which is represented by the zero mark.
The Global Supply Chain Pressure Index. Credit: Federal Reserve Bank of New York
The authors note that the index oscillates above and below this mark (the horizontal line on the graph). Not surprisingly, they observe that the supply chain shocks from the Covid- 19 pandemic, which started two years ago, have been far more severe than anything experienced in the previous 23 years. They suggest, in early January, 2022, that the data underlying the index: “seems to suggest that global supply chain pressures, while still historically high, have peaked and might start to moderate somewhat going forward.”
By Mark Burton and Julian Luk Jun 21, 2026 (Bloomberg) –The Iran war caused one of the biggest supply shocks to ever hit the aluminum market, but the runaway price surge...
(Bloomberg) — The impact of the energy crisis on the global economy in recent months is showing up in gauges of supply-chain stress that flashed red during the pandemic, adding...
By Gavin van Marle (The Loadstar) – Despite ongoing reports and warnings of worsening port congestion levels in North European ports, container shipping lines’ schedule reliability to the region saw a...
July 1, 2025
Total Views: 769
Get The Industry’s Go-To News
Subscribe to gCaptain Daily and stay informed with the latest global maritime and offshore news
— just like 104,523 professionals
Secure Your Spot
on the gCaptain Crew
Stay informed with the latest maritime and offshore news, delivered daily straight to your inbox
— trusted by our 104,523 members
Your Gateway to the Maritime World!
Essential news coupled with the finest maritime content sourced from across the globe.

 Join The Club