This Geocolor image from the National Oceanic and Atmospheric Administration (NOAA) GOES-16 satellite captures the deepening storm off the East coast of the United States on Jan. 4, 2018, at 16:22 UTC. Image credit: NASA
Lee Chesneau is a senior marine meteorologist, lecturer, & a graduate from the University of Wisconsin (Madison). Lee has had a distinguished career with NOAA’s National Weather Service (NWS), NOAA Satellite Service (NESDIS), U.S. Navy Ship Routing Officer (SRO) and a Route Analyst for Ocean Routes, Inc. This article originally appeared on the Ocean Weather Services blog.
Changes to NOAA marine products made last November and additional changes scheduled for March 7, 2018, will likely make route planning and heavy weather avoidance more difficult for the mariner.
Changes to the 500 Mb Chart since last November
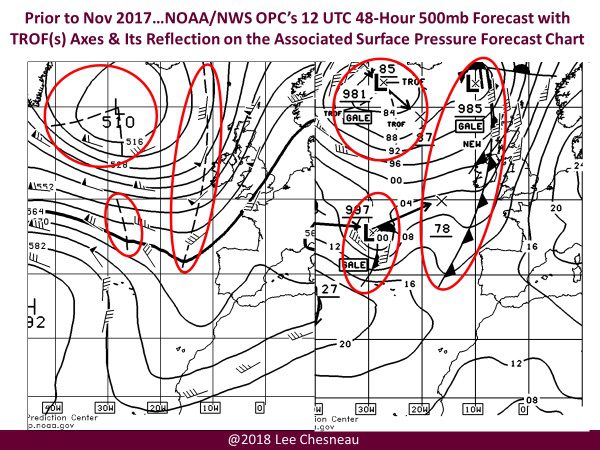
Prior to November 13th, 2017, NOAA depicted TROF axes on its 500 Mb charts, enabling a mariner to relate the upper levels of the atmosphere to the development & movement of surface weather systems, sometimes before they are even noticeable on the charts! See actual 500 Mb & associated Surface Pressure Charts below:
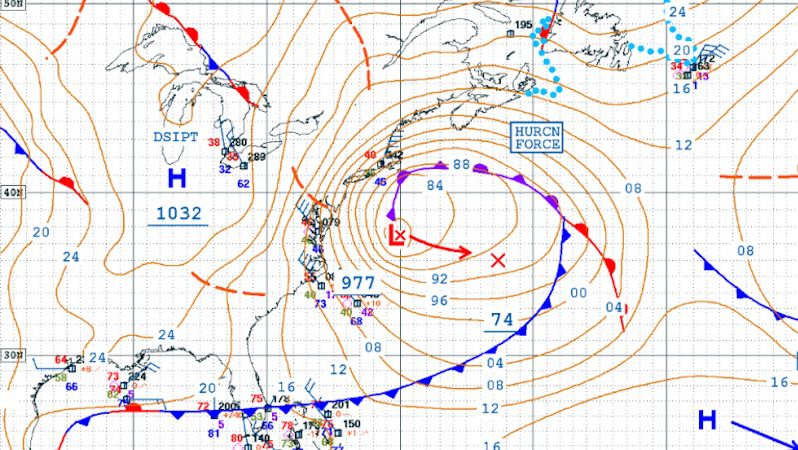
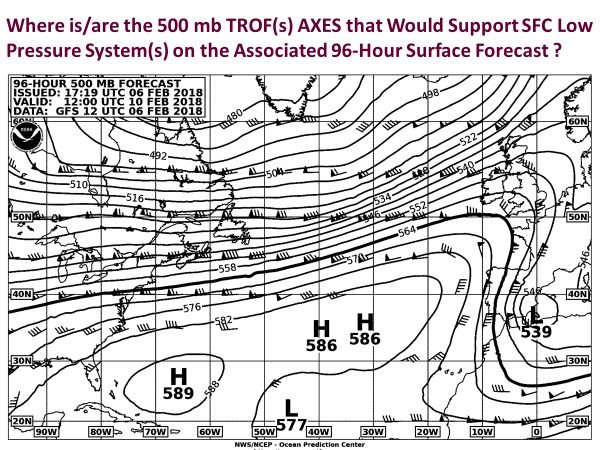
After November 13th, 2017, the 500 Mb charts now look like what you see depicted below, forcing the mariner to figure out for themselves where the TROF axes are likely to be. This change was made mostly without soliciting comments via normal maritime communications channels (e.g., “Notice to Mariners”), thus denying the mariner an opportunity to have their voices heard before these changes were implemented!
NOAA OPC 500 Mb chart after Nov. 2017
For those professional mariners who have been formally trained in NOAA products & services through continuing maritime education & training institutions such as the Maritime Institute of Technology & Graduate Studies (MITAGS), in Linthicum Heights, MD or Simulation Training and Research(STAR Center), Dania Beach, Fl & other recognized schools, be advised of new further changes to NOAA products scheduled to go into effect on Wednesday, March 7, 2018.
Changes in tracking surface systems
The current system for tracking all low and high-pressure systems use movement arrows showing 24-hours before & 24-hours forward from the “Valid Date and Time” for each of the 24, 48, and 96-Hour Surface Pressure Forecast charts. This gives the mariner the ability to not only track each low & high-pressure system through 5-days, but also to see the intensity trends as well. The new tracking system for the 4 times daily Surface Pressure Analyses charts and the 24-48 & 96 Hour Forecast charts will only show the +24-hour forecast position only for those low pressure systems of gale force winds and above.
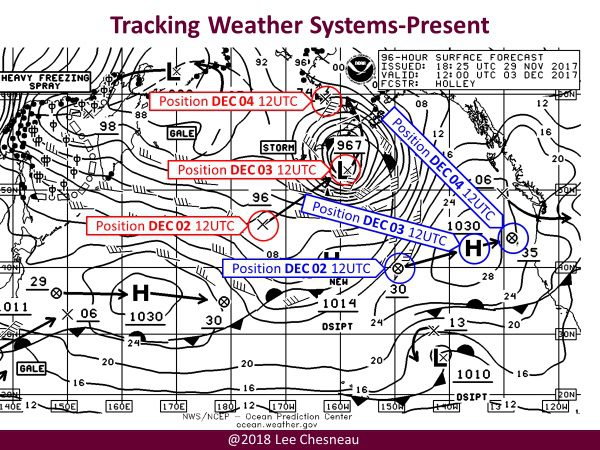
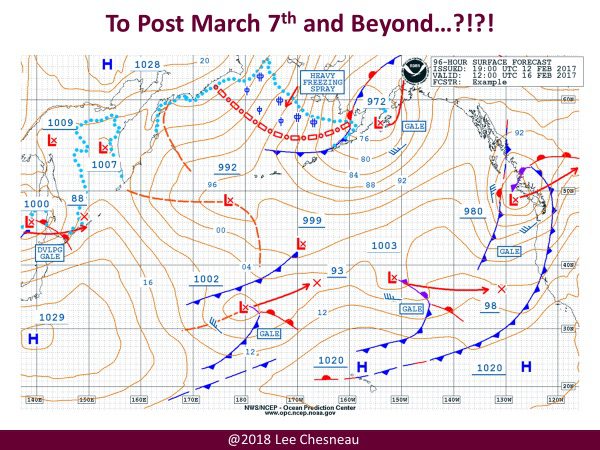
To the right is an explanation of how the surface charts are depicted today plus, below is an actual example of a NOAA 96-hour forecast chart.
This real time example of a 96-hour surface forecast chart provides tracking of all low & high-pressure systems: 24-hours before and 24-hours ahead of each systems “Valid Date & Time. The incremental 24-hour positions are depicted as an “X” for low pressure and a “X” inside a circle for high pressure. Thus, the combination of the 500 Mb charts prior to 13 November 2017 and surface pressure analyses and forecast charts up until 07 March 2018 have been described as a “Standard of Excellence”, by the Director of Training, at the Maritime Institute of Training and Graduate Studies (MITAGS).
The 500 Mb products have been routinely utilized in weather forecasting & vessel route planning. They are now less effective with the removal of the “TROF Axes”. Now, in addition, NOAA will be removing the tracking of all migratory surface low & high-pressure systems…except for those systems that NOAA deems as “hazardous”. This change will include all Surface Pressure Analyses & Forecast charts, effective on Wednesday, March 7th, 2018. Hereafter, only a forecast position arrow, signifying a low-pressure system moving ahead on the charts “Valid Date & Time” (+24-hours) will be depicted on the charts, provided they are (or forecast) to produce at least gale force surface winds (34 knots and higher). This will, in my opinion, increase the risk for a mariner to miscalculate the total weather picture when creating a route plan or when considering route changes. To quote a former Director of Training at MITAGS regarding these changes: “Imagine reading a book with every third page missing and trying to piece everything together”
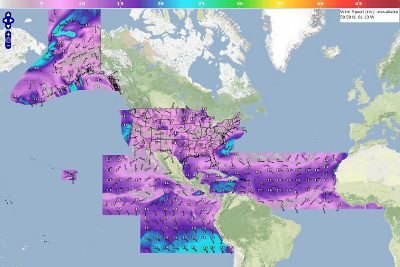
NOAA also wants to increase the oceanic coverage of their colored digital graphic plots of wind information as depicted below (National Digital Forecast Database (NDFD) forecasts). They want to populate more coverage of the north Atlantic and Pacific Oceans within their area of responsibility (SOLAS mandated alpha-numeric text forecasts area of coverage). Once again, this is in lieu of the changes made to the 500 Mb charts & changes to the Surface Pressure Forecasts charts.
NOAA National Digital Forecast Database (NDFD) forecasts graphic
Reasoning and Rebuttal
NOAA’s reasoning behind these changes appears not to be based on staffing shortfalls, nor stakeholder demands, but in their stated position to maintain their relevancy. NOAA wants to add a 72-Hour Surface Forecast product which would then be inserted between the current 48 & 96 Hours Surface Forecast charts. This may indeed sound logical, however, the downside is the significance of eliminating the tracking system currently in place for ALL MIGATORY SURFACE LOW & HIGH-PRESSURE SYSTEMS! This then would leave surface pressure analyses and forecasts charts uneven when it comes to low and high-pressure system movements (or lack thereof).
Today’s NOAA surface pressure analyses and forecasts go out to 168-hours (7-days) via the Weather Prediction Center (WPC). Thus adding, for example, a 144-Hour Surface Pressure Forecast (6-day) might be more useful than the planned 72-Hour Surface Pressure Forecast (3 day). A 144-Hour forecast would also be a game changer for vessel route planning and underway route diversions! This would be a substantial upgrade to the current NOAA product suite, as well as enhance training of mariners on using these products via institutions such as MITAGS & STAR Center.
The depicted colored digital NDFD graphics are not mandated by any IMO or STCW edict, let alone any stakeholder demand. Most importantly, they are also not universally accessible on the high seas (outside of high speed Internet range)! Once again, NOAA adding the new products jut discussed would be in lieu of the changes made to the 500 Mb charts & the imminent changes to the current Surface Pressure Analysis and Forecasts charts.
Changes like this can occur without notification, in large part, due to a lack of a process of direct communication and feedback between maritime stakeholder and with NOAA. There may also be a lack of understanding of the needs of the maritime industry stakeholders that are engaged in 90 percent of international commerce.
Lessons learned from the El Faro sinking
Some of the recommendations made by the National Transportation Safety Board (NTSB) after the sinking of the El Faro include better optimization of NOAA services to maritime stakeholders and a review of the effectiveness of Coast Guard exams and third party provided training. They also tasked the Coast Guard to provide guidance to approved maritime training schools offering operational level training in meteorology to ensure it includes training on the characteristics of weather systems, weather charting and reporting, importance of sending weather observations, sources of weather information, and interpreting weather forecast products.
In consideration of lessons learned from El Faro, the changes to NOAA’s analysis and forecast charts will, in effect, make training tasks much more difficult and unnecessary!
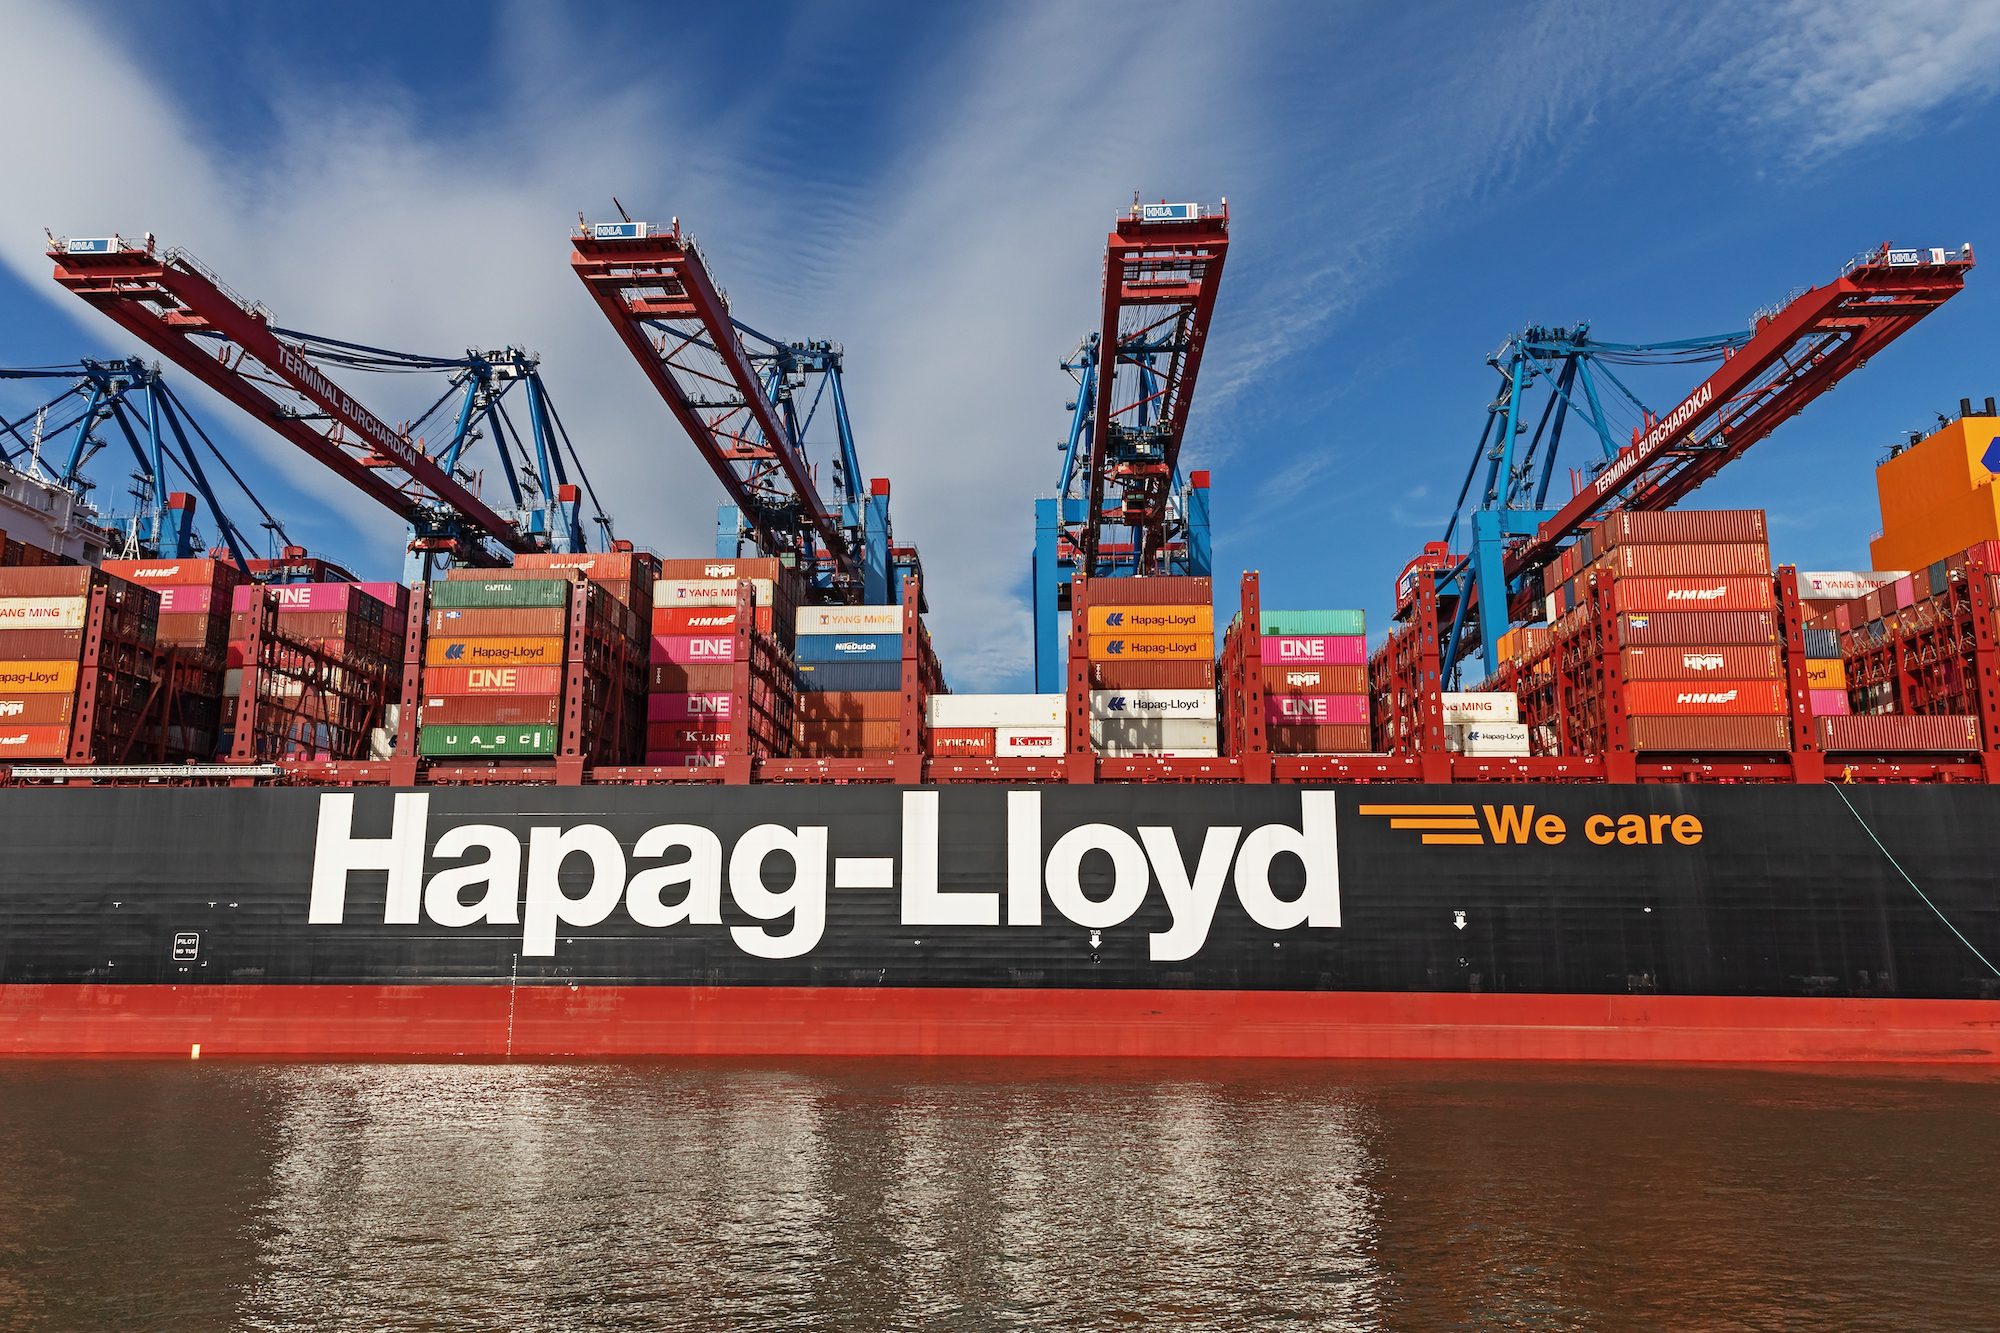
Container shipping giant Hapag-Lloyd reported a sharp deterioration in first-quarter earnings on Tuesday, blaming severe weather disruptions and the conflict in the Middle East for rising costs and weaker operational performance as...
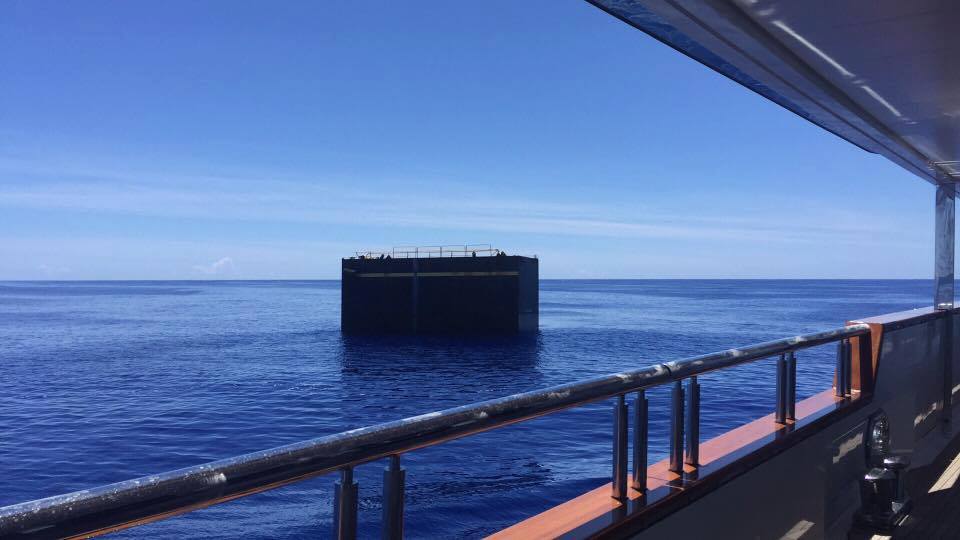
A group of Bermuda government officials and concerned yachting professionals are warning about recent sightings of at least two large sections of an unlit dry dock reportedly floating off Bermuda....
Check out this a new time-lapse video released by NOAA showing the four back-to-back nor’easter winter storms that impacted the U.S. East Coast in March 2018. The video was captured...
March 28, 2018
Total Views: 82
Get The Industry’s Go-To News
Subscribe to gCaptain Daily and stay informed with the latest global maritime and offshore news
— just like 104,901 professionals
Secure Your Spot
on the gCaptain Crew
Stay informed with the latest maritime and offshore news, delivered daily straight to your inbox
— trusted by our 104,901 members
Your Gateway to the Maritime World!
Essential news coupled with the finest maritime content sourced from across the globe.

 Join The Club