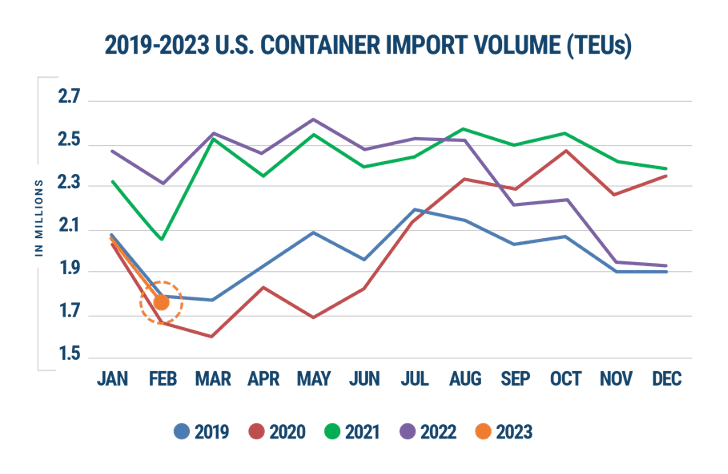
U.S. container imports in February continued to trend near pre-pandemic levels in 2019.
Descartes Systems Group (Nasdaq: DSGX) reported today its import tally for February, revealing 1,734,272 TEUs imported in February for a 25% year over year drop and down 16.2% from January 2023. Granted, February only has 28 days versus January’s 31. Also, with the Chinese Lunar New Year holiday occurring in January 2023, its impact on container import volumes were expected to be seen at U.S. ports in late February and early March 2023.
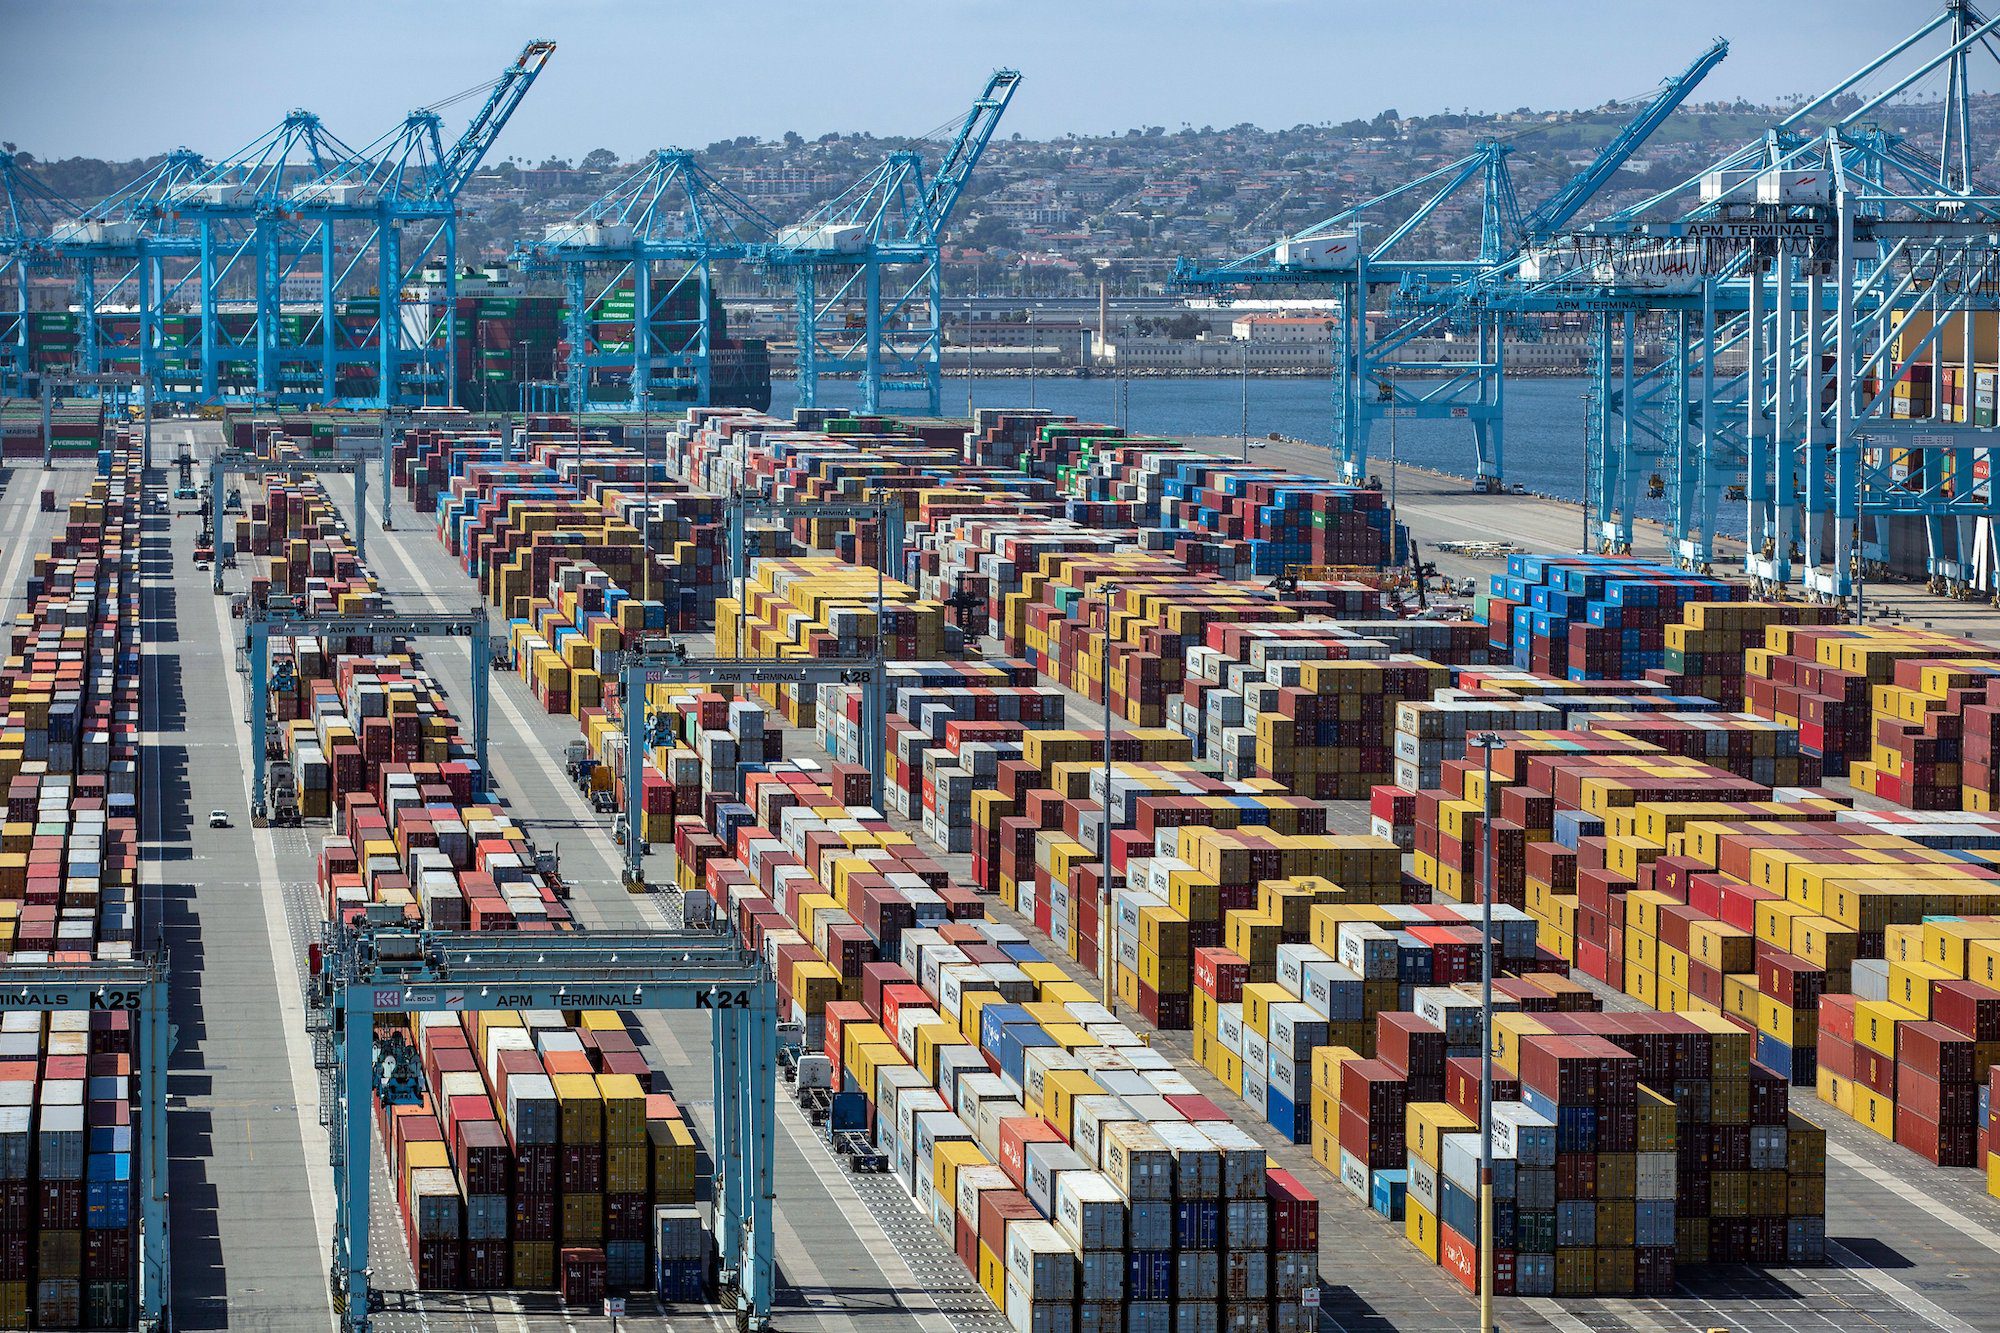
Despite the reduction, port transit delays increased for the top West, East and Gulf Coast ports, Descartes said.
“Examining imports from January and February in the previous six years, February 2023 volumes would have been expected to be significantly lower than January 2023,” said Chris Jones, EVP Industry at Descartes. “Declining container import volumes but rising port transit times demonstrate that, while 2023 volumes resemble 2019, global supply chain performance could remain uneven in 2023.”
U.S. container imports started to align with 2019 levels in November after falling sharply below 2021’s record pace starting in September as a slowing economy, retailers reducing purchases, inflation and high fuel costs have finally started to catch up to import volumes at U.S. ports.
After an upward move in January, Chinese imports into the U.S. returned to a downward trend in February 2023, according to Descartes. Compared to January 2023, imports from China decreased by 17.1% to 632,702 TEUs. Meanwhile, China represented 36.5% of the total U.S. container imports, a decline of 0.4% from the high of 41.5% in February 2022.
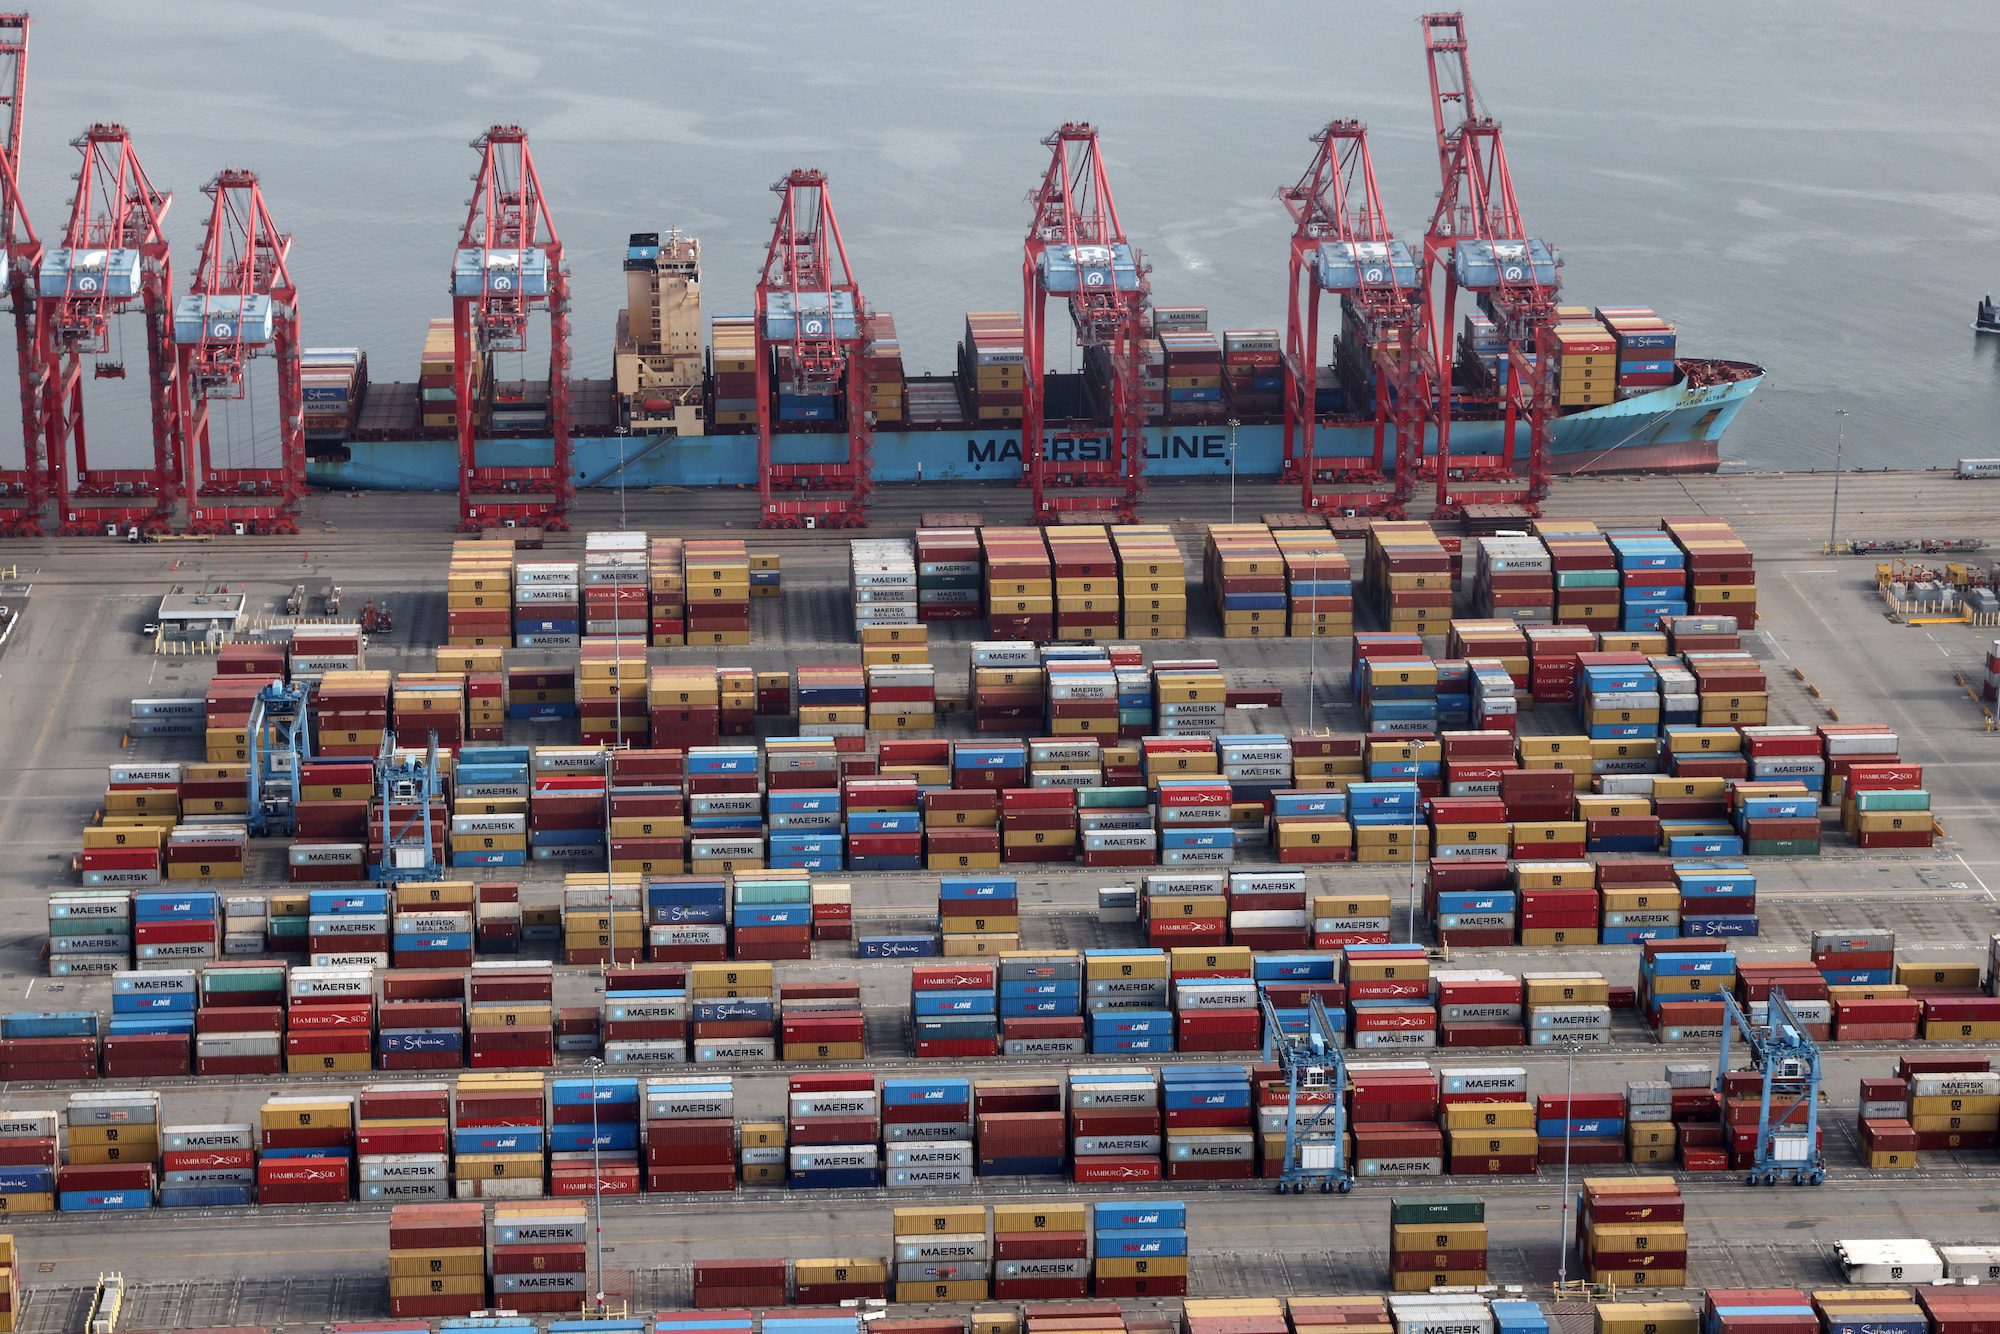
Descartes’ data shows that market share held by top West Coast ports and top East and Gulf Coast ports remained relatively stable. The Port of Los Angeles showed the greatest overall container volume decrease, representing 40% of the overall decrease in TEU quantities.
Comparing the top five West Coast ports to the top five East and Gulf Coast ports in February 2023 versus January 2023 shows that, of the total import container volume, the East and Gulf Coast ports increased to 46.8% up 1.6% versus January 2023 and the West Coast ports decreased in February to 36.0%, down 2.8% versus January 2023, Descartes said.
Amids labor uncertainties, port transit delays rose for the West Coast ports in February, while for East and Gulf Coast ports saw declining delays. With the exception of the Port of Long Beach port transit delays for West Coast ports in February 2023 are now higher than in December 2022, Descartes said.
Despite the decrease in transit delays over the past year or more, continued uncertainty regarding labor issues may still be a crucial factor in the lack of import volumes returning to major California ports., according to Descartes.
The nation’s two busiest container gateways continued to benefit from an early peak shipping season in June as importers rushed cargo into the United States ahead of potential new tariffs,...
By Lori Ann LaRocco – The Port of Los Angeles, the nation’s busiest container seaport, processed more than 1 million twenty-foot equivalent units (TEUs) in June, making it the busiest...
Container freight spot rates on the transpacific and Asia-Europe trades showed moderate gains this week, in the absence of carrier-led price hikes, while demand remained firm.
July 10, 2026
Total Views: 439
Get The Industry’s Go-To News
Subscribe to gCaptain Daily and stay informed with the latest global maritime and offshore news
— just like 104,576 professionals
Secure Your Spot
on the gCaptain Crew
Stay informed with the latest maritime and offshore news, delivered daily straight to your inbox
— trusted by our 104,576 members
Your Gateway to the Maritime World!
Essential news coupled with the finest maritime content sourced from across the globe.

 Join The Club