(Bloomberg) —
Russia’s seaborne crude exports jumped in the final week of March to the highest so far this year, even as average shipments in the first quarter were close to the level pledged by Russia to its OPEC+ partners.
Last week’s rebound came amid an easing of the high winds that repeatedly hampered loadings at Russia’s main Pacific port in recent weeks. While those earlier storms are still affecting four-week average flows, their impact is lessening. The less-volatile measure of shipments reached its highest since early November in the period to March 31, tanker-tracking data compiled by Bloomberg show.
Russia said it would cut crude exports during the first quarter of 2024 by 300,000 barrels a day from their average May-June level as part of a wider OPEC+ initiative to avert a surplus and support oil prices. Seaborne shipments in the first three months of the year exceeded that level by just 16,000 barrels a day. Over the course of the second quarter, Moscow will move away from cutting exports to focus on production targets, which are preferred by other members of the group.
The surge in shipments helped boost Moscow’s oil earnings, despite a program of sanctions designed to squeeze the Kremlin’s ability to fund its war in Ukraine. The gross value of crude exports soared to a five-month high of $1.9 billion in the seven days to March 31 from a revised $1.75 billion in the period to March 24. Four-week average income was also up, rising by about $110 million to $1.74 billion a week.
Most of the backlog of Russia’s Sokol crude that built up after being turned away by Indian refiners has now been discharged. About 9.1 million barrels, half of the total, have been delivered to refineries in China. Another 7 million barrels are finding their way back to India — though almost half of that is still on tankers anchored at Indian ports. One cargo was delivered to Pakistan.
That leaves just 1.4 million barrels still to show a destination. All of the Sokol cargoes loaded in March headed directly to China.
Flows by Destination
Russia’s seaborne crude flows in the week to March 31 rose 270,000 barrels a day to 3.74 million, its highest level for the year so far. The less volatile four-week average also increased, up by about 190,000 barrels a day to 3.47 million to the most since November.
Weekly shipments were about 150,000 barrels a day higher than the average seen in May and June, or about 450,000 barrels a day above Russia’s first quarter target that is part of the OPEC+ alliance’s broader effort to curb supplies and support prices. The four-week average was about 185,000 barrels a day above the target.
All figures exclude cargoes identified as Kazakhstan’s KEBCO grade. Those are shipments made by KazTransoil JSC that transit Russia for export through the Black Sea port of Novorossiysk and the Baltic’s Ust-Luga and are not subject to European Union sanctions or a price cap.
The Kazakh barrels are blended with crude of Russian origin to create a uniform export grade. Since Russia’s invasion of Ukraine, Kazakhstan has rebranded its cargoes to distinguish them from those shipped by Russian companies.
Observed shipments to Russia’s Asian customers, including those showing no final destination, edged higher to 3.04 million barrels a day in the four weeks to March 31, up from a revised 2.94 million in the previous four-week period. That’s the most since July.
About 1.41 million barrels a day of crude was loaded onto tankers heading to China. The Asian nation’s seaborne imports are boosted by about 800,000 barrels a day of crude delivered from Russia by pipeline, either directly, or via Kazakhstan.
Flows on ships signaling destinations in India averaged about 1.09 million barrels a day.
Both the Chinese and Indian figures will rise as the discharge ports become clear for vessels that are not currently showing final destinations.
The equivalent of about 455,000 barrels a day was on vessels signaling Port Said or Suez in Egypt, or are expected to be transferred from one ship to another off the South Korean port of Yeosu. Those voyages typically end at ports in India or China and show up in the chart below as “Unknown Asia” until a final destination becomes apparent. This figure includes stranded Sokol crude cargoes that are still waiting to discharge after failing to find homes in India since mid-December.
The “Other Unknown” volumes, running at about 50,000 barrels a day in the four weeks to March 31, are those on tankers showing no clear destination. Most of those cargoes originate from Russia’s western ports and go on to transit the Suez Canal, but some could end up in Turkey. Others could be moved from one vessel to another, with most such transfers now taking place in the Mediterranean, off the coast of Greece.
Europe and Turkey
Russia’s seaborne crude exports to European countries have ceased.
With flows to Bulgaria halted at the end of last year, Turkey is now the only short-haul market for shipments from Russia’s western ports.
Exports to Turkey rebounded to about 375,000 barrels a day in the four weeks to March 31 from a revised 313,000 barrels a day in the period to March 24.
Vessel-tracking data are cross-checked against port agent reports as well as flows and ship movements reported by other information providers including Kpler and Vortexa Ltd.
Export Value
Following the abolition of export duty on Russian crude, we have begun to track the gross value of seaborne crude exports, using Argus Media price data and our own tanker tracking.
The gross value of Russia’s crude exports soared to a five-month high, rising to $1.9 billion in the seven days to March 31 from a revised $1.75 billion in the period to March 24. Four-week average income was also up, rising by about $110 million to $1.74 billion a week. The four-week average is still well off its peak of $2.17 billion a week, reached in the period to June 19, 2022. The highest it reached last year was $2 billion a week in the period to Oct. 22.
During the first four weeks after the Group of Seven nations’ price cap on Russian crude exports came into effect in early December 2022, the value of seaborne flows fell to a low of $930 million a week, but soon recovered.
The chart above shows a gross value of Russia’s seaborne oil exports on a weekly and four-week average basis. The value is calculated by multiplying the average weekly crude price from Argus Media Group by the weekly export flow from each port. For shipments from the Baltic and Arctic ports we use the Urals FOB Primorsk dated, London close, midpoint price. For shipments from the Black Sea we use the Urals Med Aframax FOB Novorossiysk dated, London close, midpoint price. For Pacific shipments we use the ESPO blend FOB Kozmino prompt, Singapore close, midpoint price.
Export duty was abolished at the end of 2023 as part of Russia’s long-running tax reform plans.
Ships Leaving Russian Ports
The following table shows the number of ships leaving each export terminal.
A total of 34 tankers loaded 26.2 million barrels of Russian crude in the week to March 31, vessel-tracking data and port agent reports show. That was up by about 1.9 million barrels from the revised figure for the previous week.
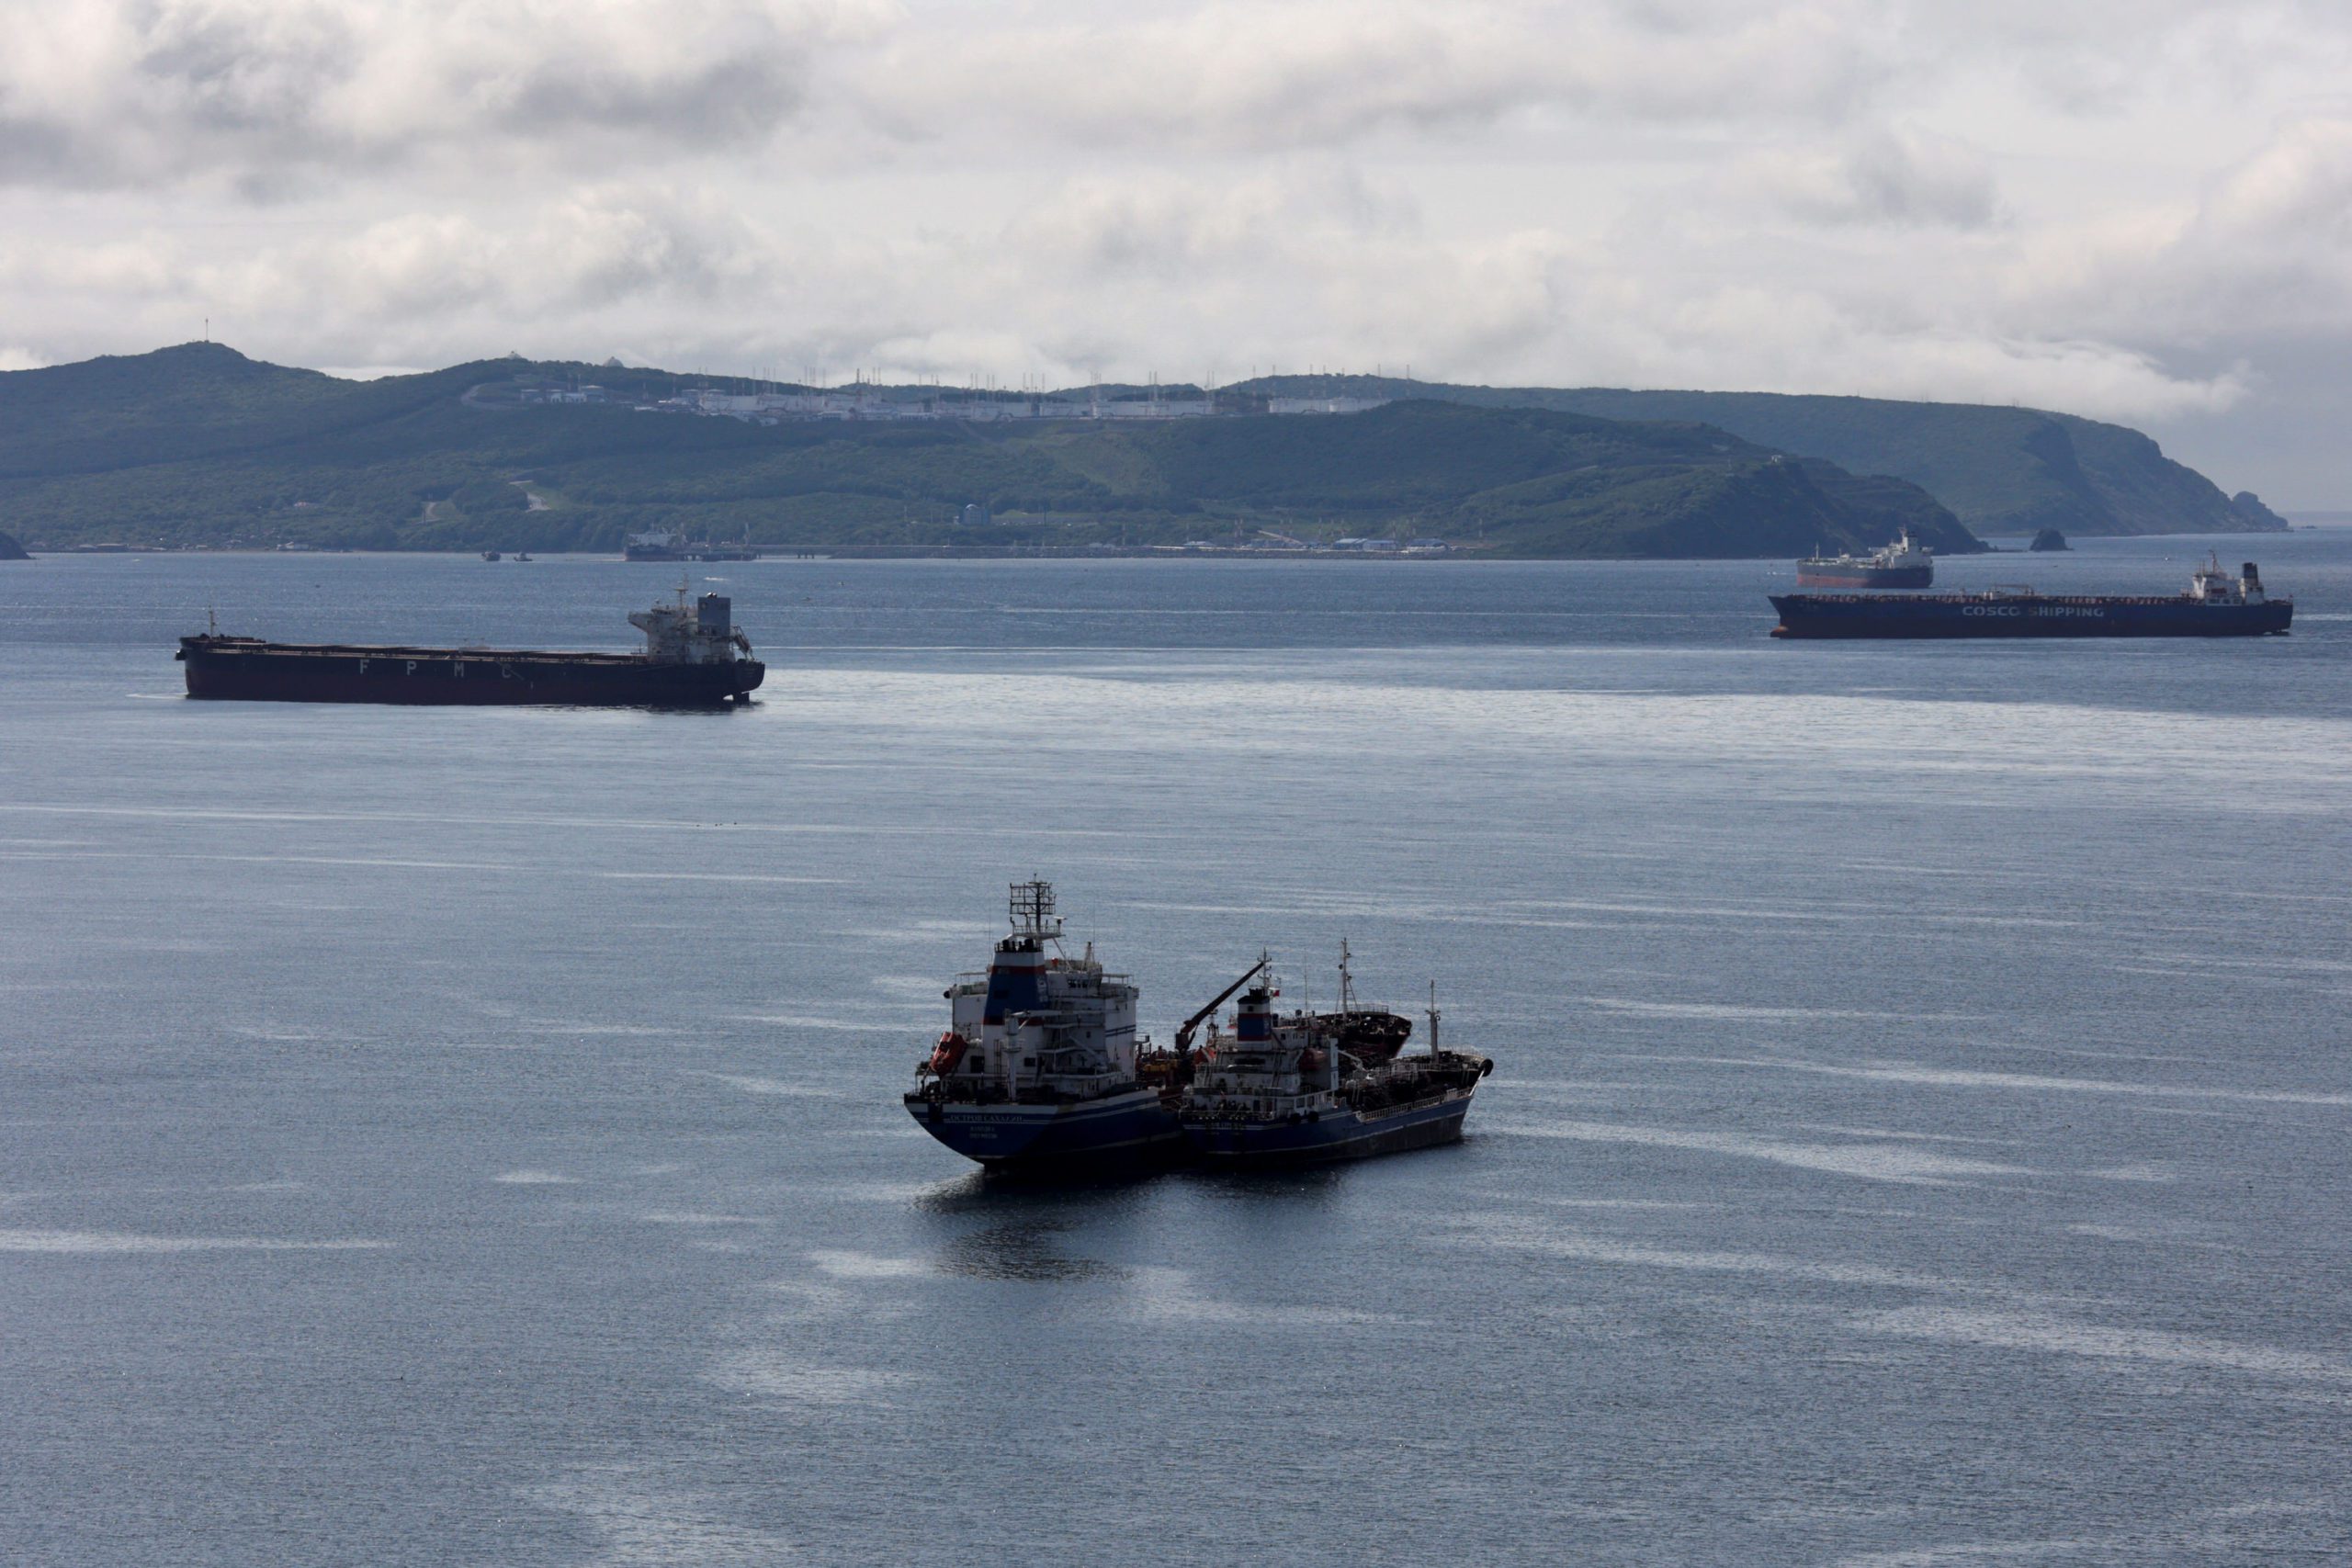
Shipments from Russia’s Pacific terminal at Kozmino returned to a more normal level after flows the previous week were hampered by winds that were gusting above 30 miles per hour, according to data from visualcrossing.com.
All figures exclude cargoes identified as Kazakhstan’s KEBCO grade. One cargo of KEBCO was loaded at Novorossiysk and one at Ust-Luga during the week.
© 2024 Bloomberg L.P.
Unlock Exclusive Insights Today!
Join the gCaptain Club for curated content, insider opinions, and vibrant community discussions.

 Join The Club


