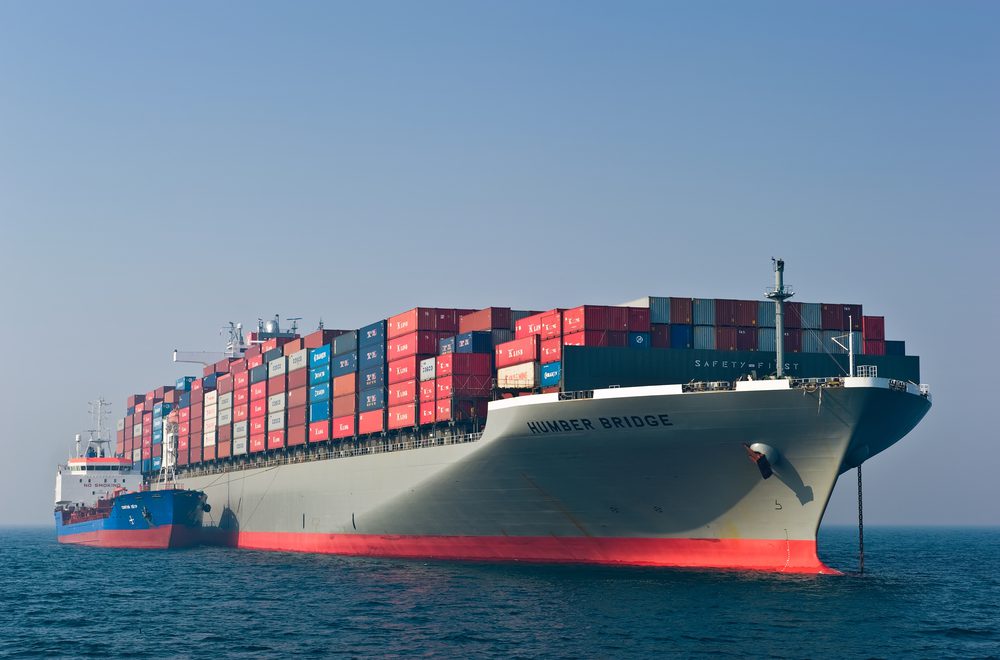
The downward trend in oil prices continues unabated. Spain’s credit rating decline created an even greater concern over sovereign debt in the Euro zone. It is starting to appear that once again the world is headed back into recession. With all global economic indicators showing everything is slowing down we have seen a dramatic decline in oil prices and commodities in general over the past month. As most of the commodity trade world wide is dominated in dollars and the dollar is increasing against other currencies of the world this is causing price declines. As we all know supply and demand fundamentals also indicate prices should be lower. Potential problems with Iran still loom large on the horizon, but even this can not slow the precipitous decline in oil prices.
Bunker prices have moved to levels that have not been seen in over six months. Predicting this massive decline in bunker prices would have been impossible six months ago as it looked like the global economy was starting to move in the right direction. It is startling to look at how the markets have chanced in that time. Over the last 100 years of the financial markets it has been very rare to see upward and downward movements where over 90% of stocks and commodities move in the same direction. By rare we mean it would happen less than a handful of times per year. In 2011 this happened on 70 trading days or more than 25% of the time. It is not clear exactly what this indicates, but one thing is for certain, historical markets can no longer predict future markets.
Let’s all hope this economic uncertainty does not last long.
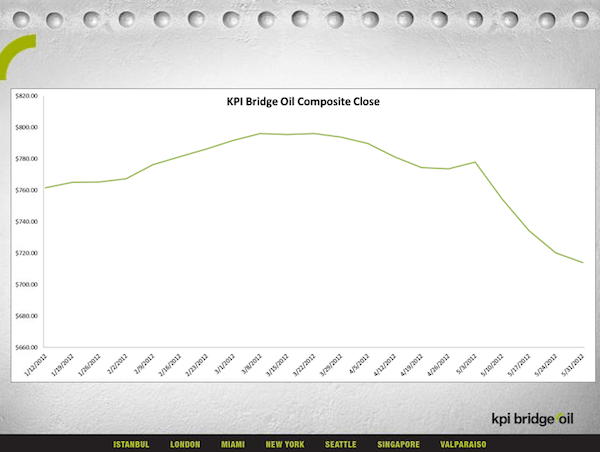
About the KPI Bridge Oil Composite
The KPI Bridge Oil Composite is a calculated fuel number based on 14 ports strategically positioned worldwide. It is calculated on a weekly basis blending 90% fuel oil prices with 10% distillate prices. The idea behind the number is that it would represent actual fuel costs on a global basis and what vessels would consume on average. This number will not fluctuate as quickly as daily prices and can easily be hedged or used for voyage calculations.
Editorial Standards · Corrections · About gCaptain

 Join The Club