Trump Tariffs on Russia’s Oil Buyers Bring Economic, Political Risks
From punishing Brazil to trying to curb imports of fentanyl, U.S. President Donald Trump has wielded the threat of tariffs as an all-purpose foreign policy weapon.

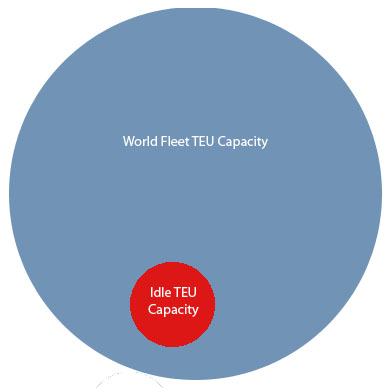
To give everyone a good sense to the extent of the container shipping crisis, we have put together this Bubble Chart using IBM’s Many Eye’s software (with a little help from photoshop). The chart above gives a good visualization to the idle container ship TEU capacity compared to the world fleet.
According AXS-Alphaliner and Shipping Digest, idle ships as of mid-January had a total TEU capacity of 675,000 or over 5% of the world container ship fleet by TEU capacity. Predictions for February are expected to reach as much as 750,000 TEU’s.
For those of you that are not who are not visually oriented, we have also provided the hard data.

For an interactive version of the above bubble chart, you can find one HERE

Sign up for gCaptain’s newsletter and never miss an update

Subscribe to gCaptain Daily and stay informed with the latest global maritime and offshore news
Essential news coupled with the finest maritime content sourced from across the globe.
Sign Up