By CW4 Michael W. Carr, US Army Watercraft Master (Retired)
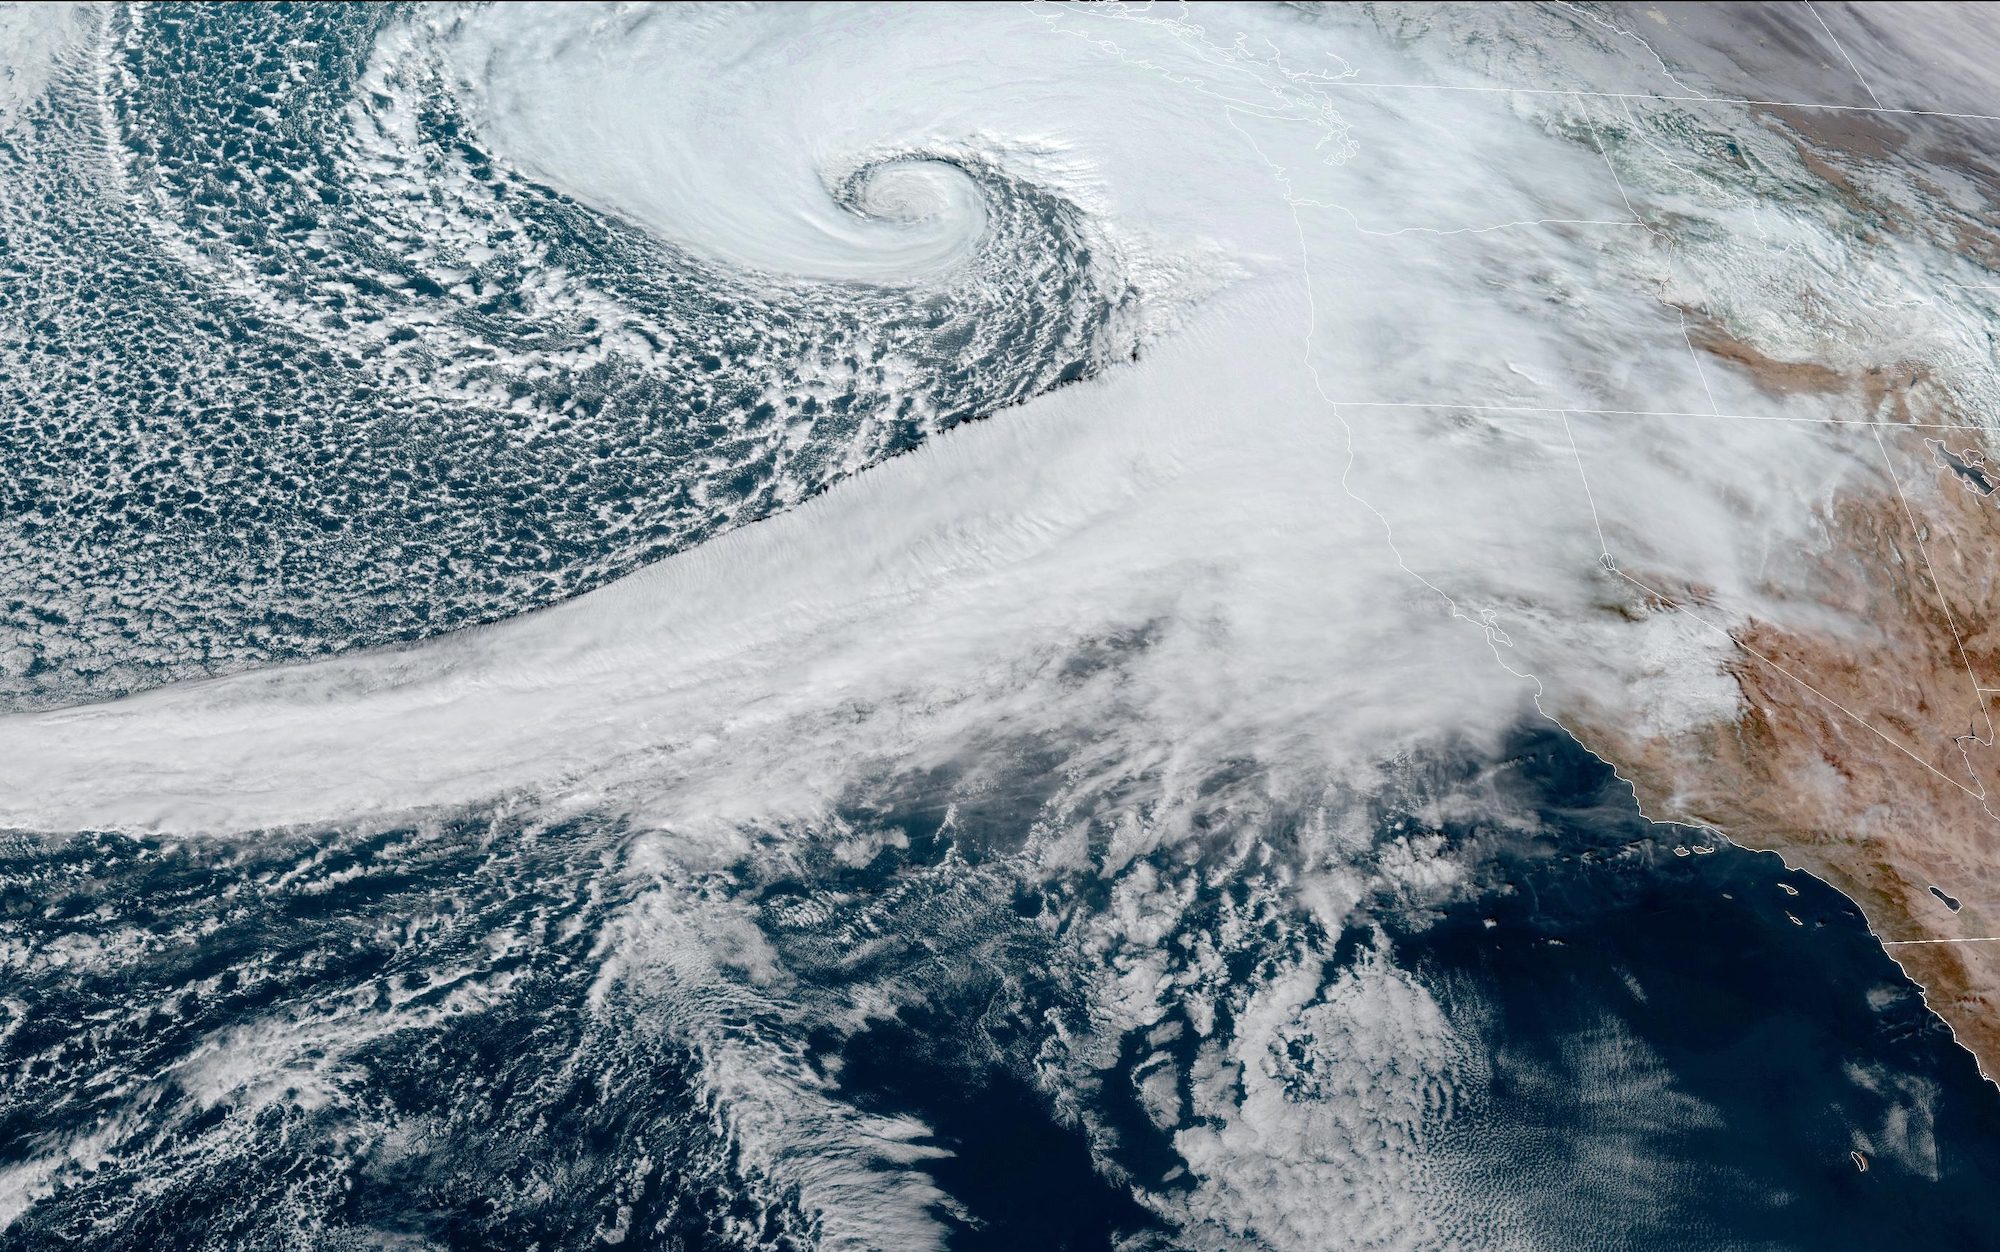
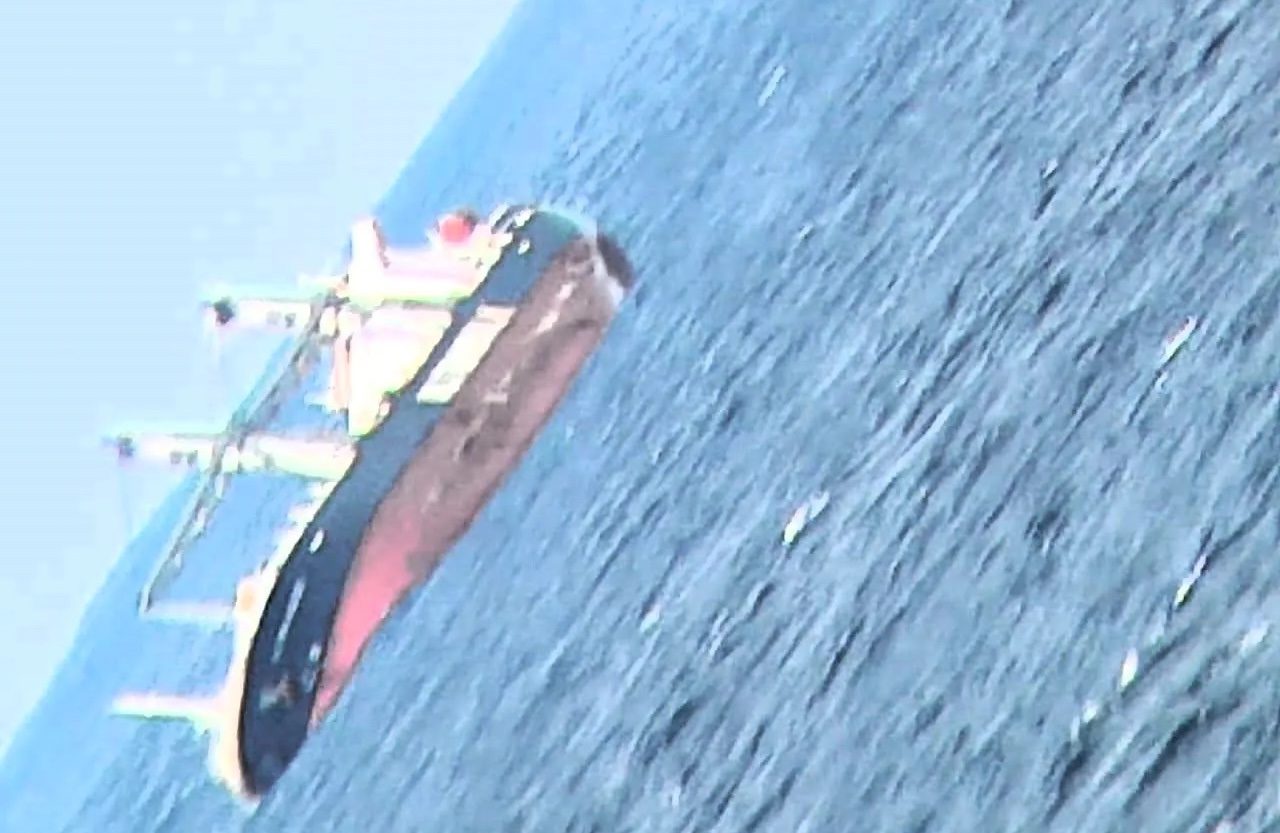
All too frequently we read on gCaptain about vessels losing containers when impacted by high seas. Of the six motions encountered by a ship (heave, yaw, roll, surge, pitch, sway), it is roll that dramatically increases loads on container cell guides, twist locks, peck and hale fittings, and lashings. Avoiding beam seas, in particular beam seas which lead to synchronous rolling (where a vessel’s natural roll period is equal to the sea’s period), must be avoided, or at least minimized.
Planning a route to meet arrival deadlines, avoiding synchronous rolling, and not losing cargo overboard is both an art and a skill. There exist a plethora of computer routing programs which can assist a mariner in route planning and then route deviation, but to use these programs effectively a mariner must understand what factors are being used by the software to develop a proposed route. And how current and accurate is that information. We certainly all remember EL FARO’s fate when her Captain made decisions based on outdated and inaccurate weather data, and lack of knowledge on EL FAROs stability.
A correct route for one vessel is not necessarily the correct route for another vessel sailing between the same departure and arrival ports. A vessel’s speed, her roll period, her ability to plow through head seas, and her windage are just a few factors. A US Navy destroyer and a car carrier would likely use different routes when crossing the Pacific Ocean during winter months.
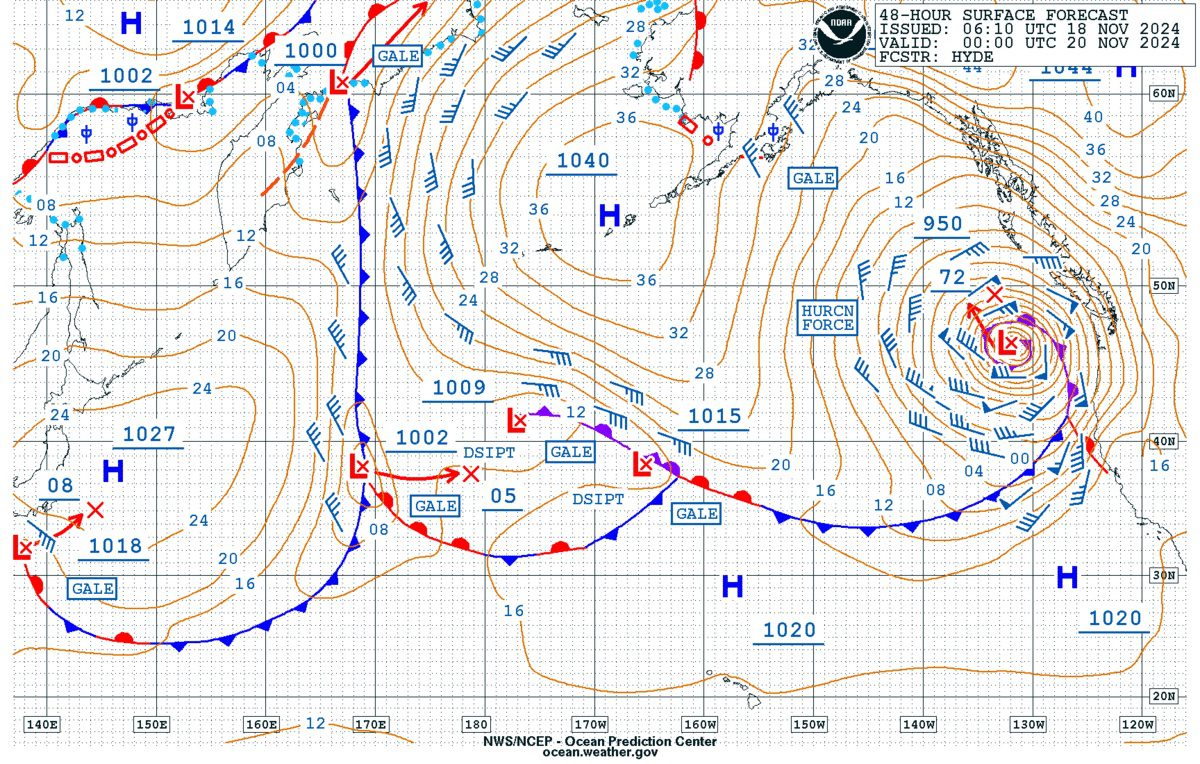
A simple and effective method to determine a route prior to departure is to lay out four (4) routes: Great Circle, Modified Great Circle, Rhumb Line, and Bucket route. Then overlay on these routes the Ocean Prediction Centers (https://ocean.weather.gov) 500 MB charts, which forecast accurately out to 120 hours. Note the 5640 height contour which denotes the southern extent of storm force surface winds. Measure 300 nm north of the 5640 height contour (which is always the darkest height contour shown on the 500 mb chart). Note where the four routes you plotted fall in relation to the area bounded by the 5640 height contour and the 300 nm line drawn parallel and to the north of the 5640 contour.
If you keep your vessel out of this “no mans land” you will avoid storm force winds, which produce the high seas which lead to rolling, accelerated loads and loss of containers. If you examine the Ocean Prediction Center’s Surface analysis and forecast charts, along with sea state and wave period charts, and ocean current charts (Kuroshio in the Pacific and Gulf Stream in the Atlantic) you can adjust, tweak and predictably avoid heavy weather situations.
Vessel routing is an ongoing process, where the route is adjusted daily, or sometimes hourly, to minimize the duration of encounter between unsuitable weather and a vessel’s forward advance. I think of vessel routing as analogous to driving down a busy highway where you adjust your lane and speed to keep heading in the desired destination. On ramps and exits are methods to avoid congestion and accidents, just as vessel course & speed adjustments avoid plowing into heavy weather.
Computer routing programs are often not as sophisticated or capable as a mariner who examines 500 mb, surface, wind wave, and wave period charts. Using knowledge of your vessel’s actual capabilities, your cargo, your reserve GM, and other factors a mariner can adjust course and speed to stay ahead of adverse weather.
While sailing as Master on slow moving US Army LCUs and LSVs (10 knots was our planning speed) I would examine Ocean Prediction Center charts several times a day, and adjust (tweak) our intended track to maintain wind and seas abaft the beam, and minimize rolling. Yes, there were times where weather systems developed quickly and we would endure some short term discomfort. However, the 500 mb chart was always correct, and by staying outside the 5640 height contour defined “area to avoid” we were always able to avoid severe weather.
Editorial Standards · Corrections · About gCaptain

 Join The Club