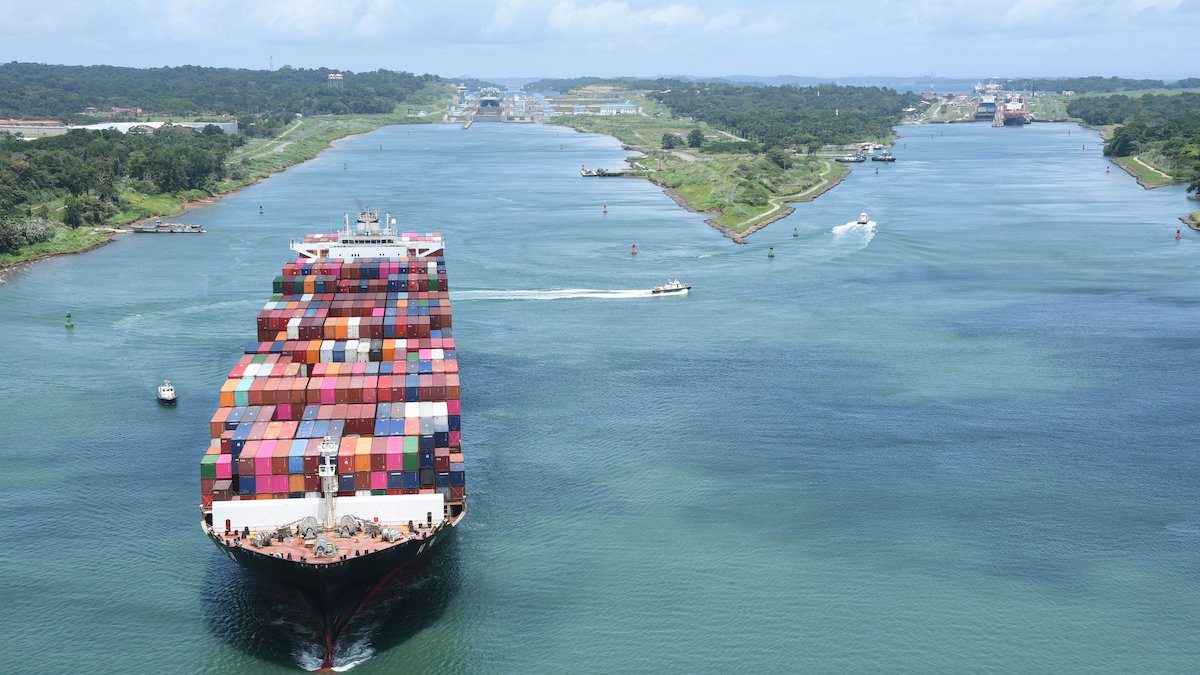
Photo courtesy Panama Canal Authority (ACP)
By Mike Wackett (The Loadstar) – The number of containerships transiting the Panama Canal during its fiscal year ending 30 September declined slightly, by 1.1% to 2,575.
But there could be further reductions after ocean carriers announced a number of blanked sailings in the coming weeks on their Asia to US east coast all-water schedules ahead of the slack season.
Dry bulk ships were the biggest users of the waterway, 2,657 vessels, also down 1.1%; chemical tankers, at 2,035, were down just 0.4%; and LPG carriers with 1,087 transits, were down 6.9%.
However, the total number of transits for all market segments was virtually unchanged over the year, at 12,281 ships.
Notwithstanding the continued upsizing of container vessels using the expanded canal, cargo tonnage carried was also down during the year, by 1.4%, suggesting that the impact of the shorter all–water route from Asia over the intermodal service via the US west coast has peaked.
Earlier in the year, transpacific carriers added extra Asia-US east coast loaders to meet a Chinese imports tariff-beating demand spike, including the launch of a new 2M/Zim string, adding some 7% of capacity to the route.
However, vessel capacity on some services had to be temporarily restricted in the summer due to revised maximum draught limits of 13.1 metres from 13.4m for the neo-panamax locks.
The $5.5bn project to widen the Panama Canal’s locks was completed in June 2016, enabling containerships of up to 13,000 teu to transit the waterway, compared with the previous maximum of some 5,100 teu. It proved to be a game changer for the routing of containers from Asia to the US.
The roughly 14–day saving on the all-water route via the Suez Canal, and cost savings over the intermodal route alternative via the US west coast, have been drivers of the solid growth at US east coast and Gulf coast ports.
According to Blue Alpha Capital data, the number of containers handled by container terminals on the east coast increased 5.4%, year on year, in the three months to the end of August, to 2,551,099 teu. But the biggest winners were the Gulf Coast ports, gaining an average of 7% in box volumes in the period.
And New York also improved, by 3.5%, recording a much better performance than its west coast rivals. Indeed, the major west coast ports posted a decline of 1.9% in the same period, to 2,895,778 teu.
Moreover, container spot rates on the Asia to US east coast tradelane have been more robust than for the west coast route, standing at some $2,346 per 40ft, compared with approximately $1,300 for the west coast.
Nevertheless, both markets have been hit by the volatility triggered by the US/China trade war, which has prompted an erosion of rates of some 13% for the east coast and 18% for the west since the end of August.
This has prompted carriers to announce a raft of blanked sailings on both routes which could extend right through the slack season.
As a consequence, the Panama Canal Authority can expect a reduction in the number of Asia to US east coast transits in the coming months.
The Loadstar is fast becoming known at the highest levels of logistics and supply chain management as one of the best sources of influential analysis and commentary.
Check them out at TheLoadstar.co.uk, or find them on Facebook and Twitter.
Editorial Standards · Corrections · About gCaptain

 Join The Club