(NASA)–In 2021, NASA’s fleet of Earth-observing satellites, as well as the instruments and astronauts on the International Space Station, captured some compelling moments on our planet.
From record-breaking heatwaves to pandemic-related events, the images in this list showcase some of the beautiful and complex events that occurred on our planet in the past year. They also demonstrate how NASA’s Earth-observing technologies and missions provide valuable information to scientists, government agencies, and people around the world.
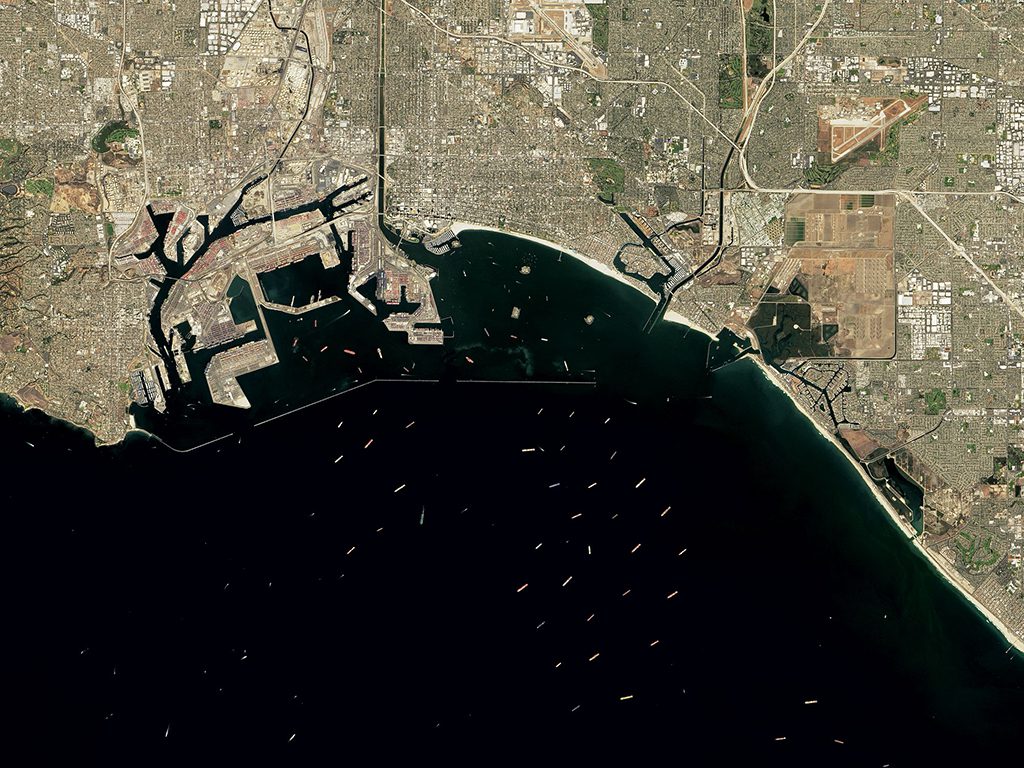
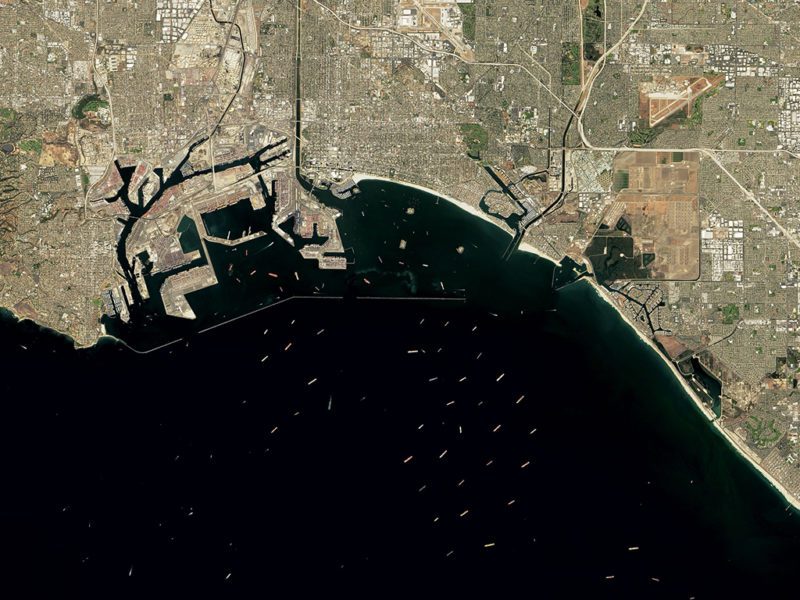
The pandemic has disrupted global supply chains and markets in ways that have led to backlogs of cargo ships at key ports. Image of the Day for October 15, 2021 NASA Earth Observatory image by Joshua Stevens, using Landsat data from the U.S. Geological Survey.
Booming demand for consumer goods, labor shortages, bad weather, and an array of COVID-related supply chain snarls contributed to backlogs of cargo ships at ports around the world in 2021. On Oct. 10, the Operational Land Imager (OLI) on Landsat 8 captured this natural-color image of dozens of cargo ships waiting offshore for their turn to unload goods near the ports of Los Angeles and Long Beach in Southern California, the two busiest container ports in the United States. Shipping traffic jams were not limited to Los Angeles, or even to the United States. Ports in Malaysia, Singapore, Hong Kong, and Shanghai all had queues of container ships waiting offshore at various points throughout the year, according to news sources.
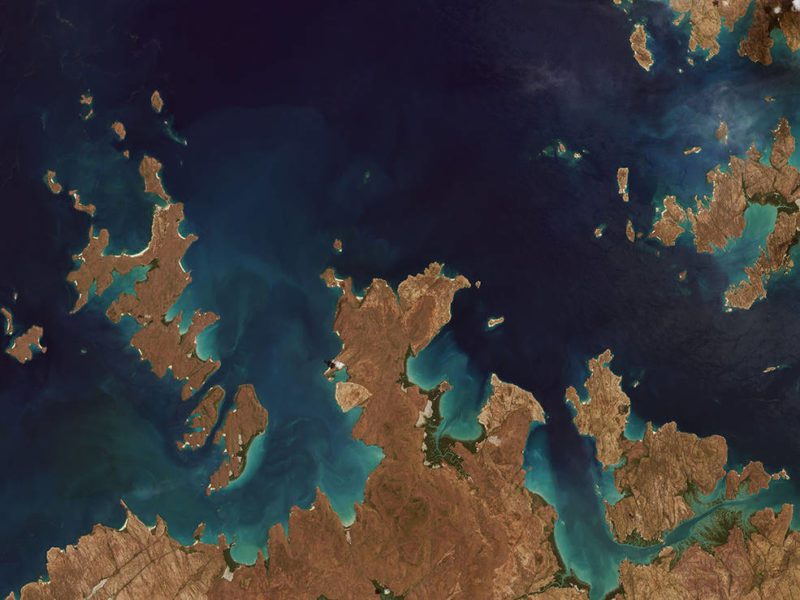
NASA image by Norman Kuring/NASA’s Ocean Color Web, using Landsat data from the U.S. Geological Survey.
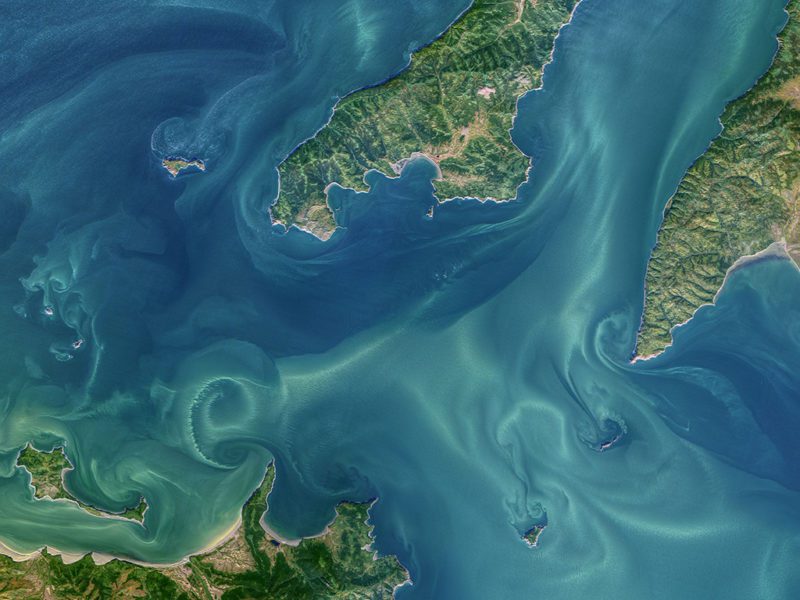
Some of the highest diurnal tides in the world—nearly 14 meters (46 feet)—have been recorded in the Sea of Okhotsk. In the Russian Far East, narrow bays funnel and amplify the incoming tides, making it a prime location for tidal power generation.
The transition from smooth, laminar flow to mixed, turbulent flow is visible in this natural-color image of the western Sea of Okhotsk. The image of the Shantar Islands and Uda Bay was acquired on Sept. 24, 2021, by the Operational Land Imager (OLI) on Landsat 8.
The currents around the Shantar Islands are heavily influenced by the strong tides and by freshwater discharge from rivers draining into Uda Bay. The waters here are frozen for much of the year. When the sea ice melts and freshwater snowmelt swells the Uda River, plumes of low-salinity water can reach far offshore.
As the strong tides and currents flow through straits in the Shantar Islands, they encounter rocky outcrops, headlands, capes, and small islands that disrupt the laminar flow. This can create chains of spiral eddies that rotate in alternate directions as they form. These chains are known as vortex streets or von Kármán vortices. The physical processes that create the vortices were first described in 1912 by Theodore von Kármán, a Hungarian-American physicist and a co-founder of NASA’s Jet Propulsion Laboratory.
Astronaut photograph ISS065-E-163199 was acquired on July 9, 2021, by a member of the International Space Station’s Expedition 65 crew. The image has been cropped and enhanced to improve contrast, and lens artifacts have been removed.
An astronaut onboard the International Space Station (ISS) snapped this photograph of a portion of the Paraná River, the second longest river in South America. It flows mostly northeast to southwest for 3,030 miles (4,880 kilometers), passing through Brazil, Paraguay, and Argentina and making part of the Argentina–Paraguay border.
This image captures some of the interlocking, braided patterns that are common along the Paraná River system. Sediment that eroded upstream from riverbanks in Brazil was carried downriver and deposited and piled up into islands—such as Isla Apipé (Argentina). The sediments also make braid bars, which are smaller, rhomboid-shaped landforms created by the interweaving of water and land as the river level rises and falls over time.
This labyrinth of braided channels also provides routes for small boats and ships, allowing for the transport of goods to inland South America—at least as far upstream as the Yacyretá Dam. Built to generate hydroelectric power, the dam now separates the upper Paraná River from the braid bars.
Farmers cultivate crops such as coffee, corn, and cotton in fields adjacent to the Paraná River floodplain. These crops, among others, have been affected by ongoing drought conditions that began in the region in 2020 and slowed the transport of goods due to decreased water levels.
NASA Earth Observatory image by Joshua Stevens, using data courtesy of Gardner, J., et al. (2020).
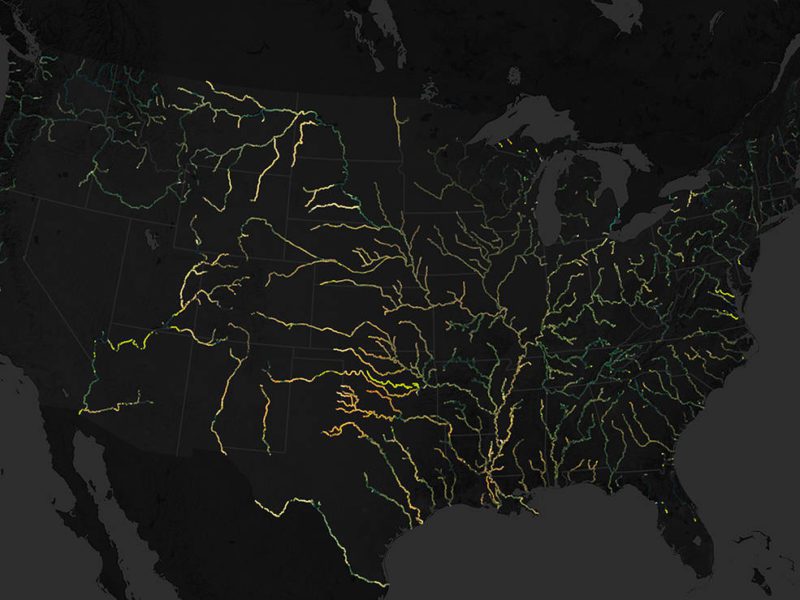
Much like the sky, rivers are rarely painted one color. Rivers around the world appear in shades of yellow, green, blue, and brown—and subtle changes in the environment can alter their colors.
New research shows the dominant color has changed in about one-third of large rivers in the continental United States over the past 35 years.
The figure above shows data from a map of river color for the contiguous United States. The rivers are colored as they would approximately appear to the human eye. The map was built from 234,727 images collected by Landsat satellites between 1984 and 2018. The dataset includes 67,000 miles (100,000 kilometers) of waterways of at least 200 feet (60 meters) wide.
While is not unusual for rivers to change colors over time due to fluctuations in flow, concentrations of sediments, and the amount of dissolved organic matter or algae in the water, scientists have found that the most extreme changes often occur near man-made reservoirs. Around 56 percent of rivers were dominantly yellow over the course of the investigation, and 38 percent were dominantly green.
NASA image by Matt Radcliff, using Landsat data from the U.S. Geological Survey.
This year, NASA and the U.S. Geological Survey provided the public with a powerful new camera to observe our changing planet.
This natural-color image—which shows the Coronation Islands along the Kimberly coast of Western Australia—was one of the first to be taken by the new Landsat 9 satellite on Oct. 31, 2021, about a month after launching from Vandenberg Space Force Base in California.
Building on an unparalleled record of Landsat missions that span nearly 50 years, Landsat 9 is a joint mission between NASA and USGS. The new satellite and instruments are quite similar in design to Landsat 8, which was launched in 2013 and remains in orbit. Together, the two satellites will collect approximately 1,500 images of Earth’s surface every day, observing the entire planet every eight days.
Landsat 9 carries two main instruments: the Operational Land Imager 2 (OLI-2), which detects visible, near-infrared, and shortwave-infrared light in nine wavelengths, and the Thermal Infrared Sensor 2 (TIRS-2), which detects thermal radiation in two wavelengths used to measure Earth’s surface temperatures. These instruments can provide users with essential information about crop health, irrigation use, water quality, wildfire severity, deforestation, glacial retreat, and urban expansion, especially when put in the context of the long Landsat data record.
The data from Landsat 9 will be available to the public for free from the USGS website once the satellite begins normal operations in 2022.
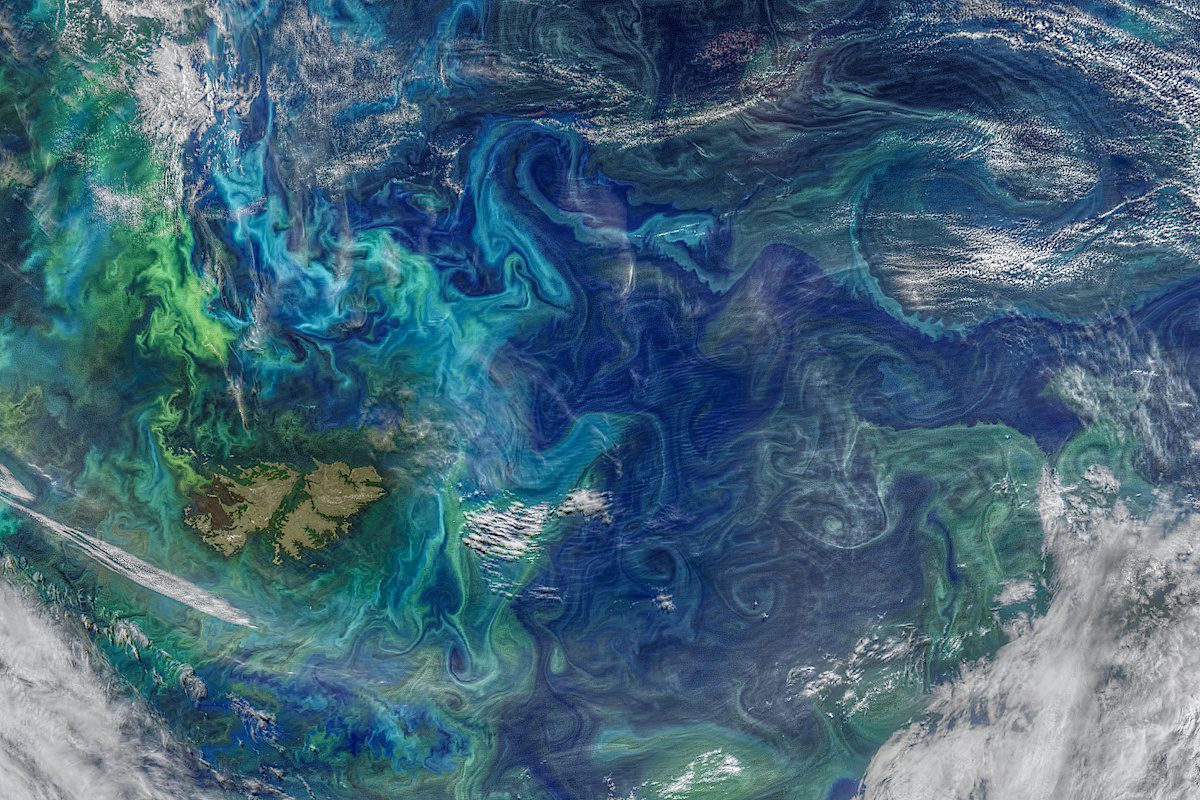
Using scientific instruments aboard a self-propelled ocean glider and several airplanes, this first deployment of the Sub-Mesoscale Ocean Dynamics Experiment (S-MODE) mission will deploy its suite of water- and air-borne...
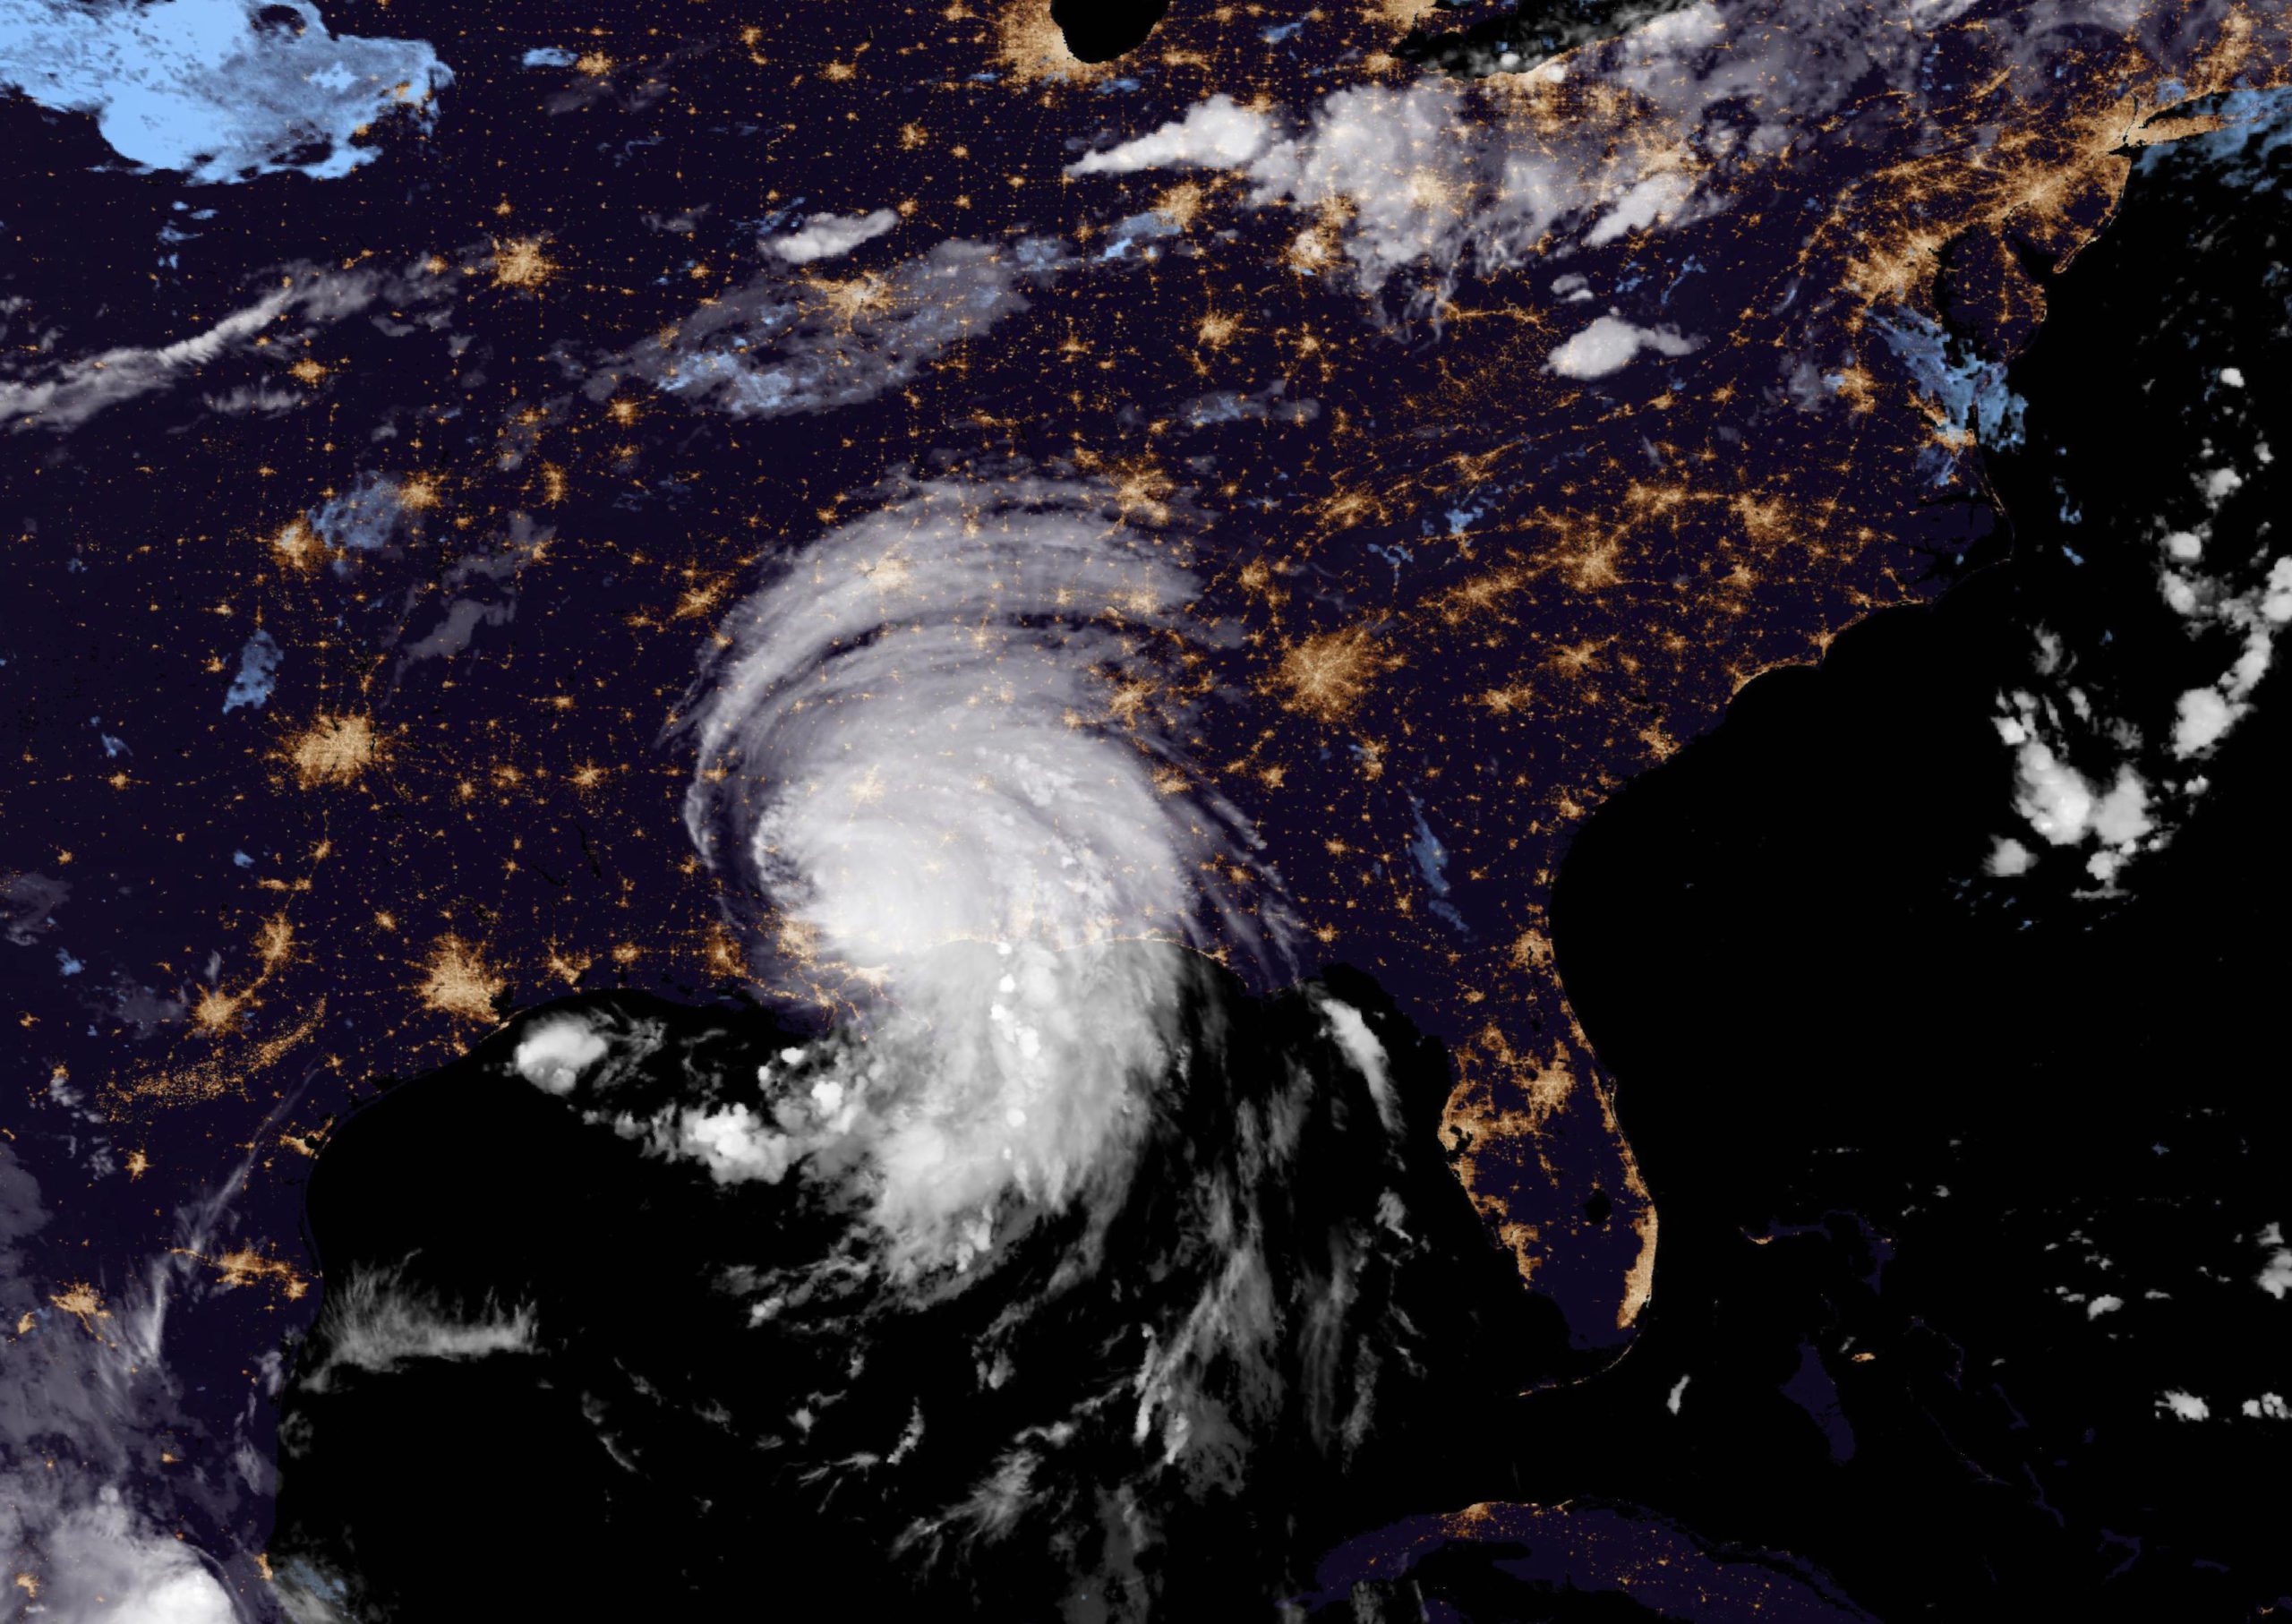
(NASA) Captured in the early morning hours of Monday, Aug. 30, Tropical Storm Ida is seen moving inland over portions of southeastern Louisiana, southern Mississippi, and southern Alabama. A NOAA...
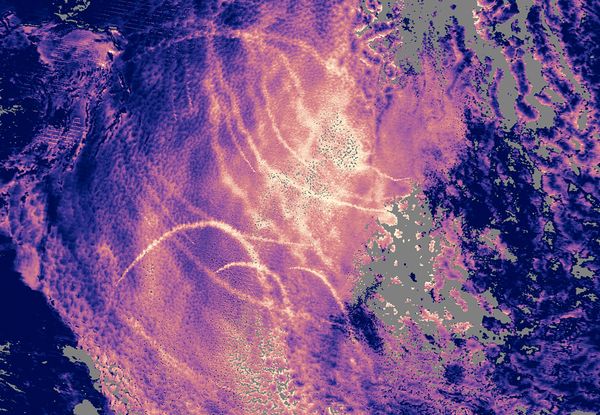
This is pretty cool. The photo above is from National Geographics collection of “Space Photos This Week” and is titled Ship Tracks in Sky. Using NASA’s Terra Satellite, the image...
July 16, 2010
Total Views: 44
Get The Industry’s Go-To News
Subscribe to gCaptain Daily and stay informed with the latest global maritime and offshore news
— just like 104,486 professionals
Secure Your Spot
on the gCaptain Crew
Stay informed with the latest maritime and offshore news, delivered daily straight to your inbox
— trusted by our 104,486 members
Your Gateway to the Maritime World!
Essential news coupled with the finest maritime content sourced from across the globe.

 Join The Club