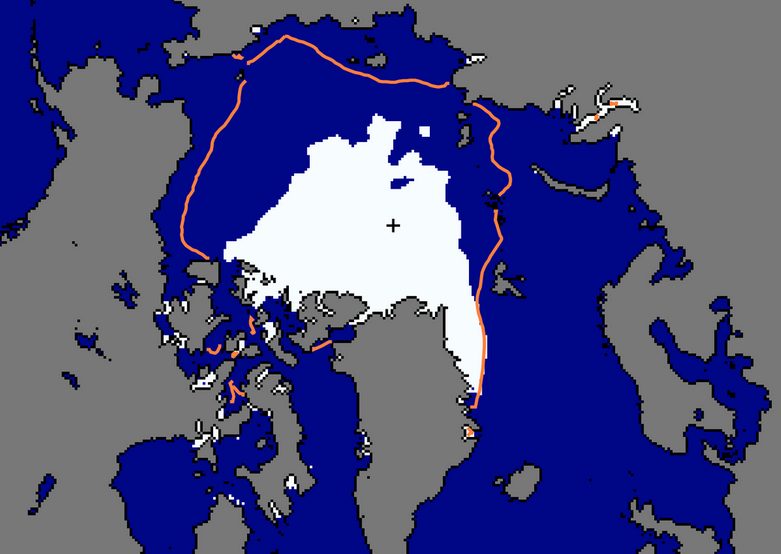
Arctic sea ice appears to have reached its minimum extent for the 2012 melt season at a mere 3.41 million square kilometers (1.32 million square miles), shattering previously held minimum extent records and reinforcing the long-term downward trend in Arctic ice extent
Arctic sea ice extent for September 16, 2012 was 3.41 million square kilometers (1.32 million square miles). The orange line shows the 1979 to 2000 median extent for that day. The black cross indicates the geographic North Pole. Credit: National Snow and Ice Data Center
(Bloomberg) — Arctic sea ice on Sept. 16 shrank to its lowest ever in a satellite record stretching back 33 years, according to the U.S. National Snow and Ice Data Center.
Sea-ice cover shrank to 3.41 million square kilometers (1.32 million square miles), 18 percent less than the previous record from 2007, Boulder, Colorado-based NSIDC said today in an e-mailed statement.
The shrinking Arctic ice cap is one of the most visible signs of climate change, according to NSIDC Director Mark Serreze.
“While we’ve long known that, as the planet warms up, changes would be seen first and be most pronounced in the Arctic, few of us were prepared for how rapidly the changes would actually occur,” Serreze said in the statement. “We are now in uncharted territory.”
Coverage melted to 4.17 million square kilometers in September 2007. The average annual minimum area from 1979 to 2010 was 6.29 million square kilometers.
Sea ice melts every summer and typically begins freezing again in September. The Sept. 16 figure will probably be the low point for this year, NSIDC said. The research agency uses five- day averages to calculate measurements to account for day-to-day anomalies.
-By Alex Morales and Justin Doom. Copyright 2012 Bloomberg.
The above graph shows Arctic sea ice extent as of September 17, 2012, along with daily ice extent data for 2007 and 2005, the previous record low years. 2012 is shown in blue and 2007 in green. The gray area around the average line shows the two standard deviation range of the data. Credit: National Snow and Ice Data Center
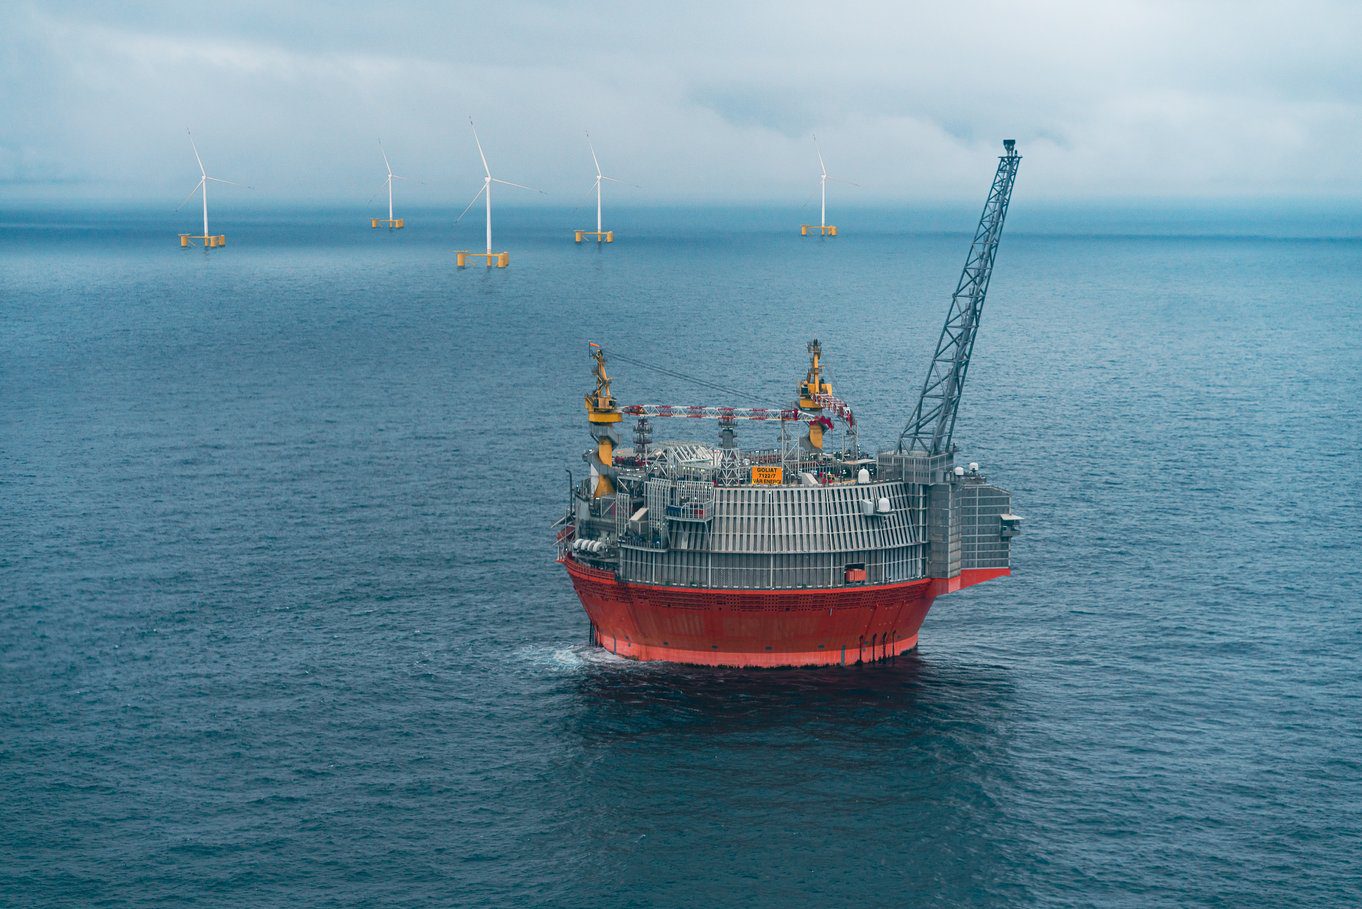
Odfjell Oceanwind says its innovative floating wind turbine foundation solution Deepsea Star™ has been chosen for the groundbreaking GoliatVIND wind park project in the Barents Sea. A consortium comprising Source...
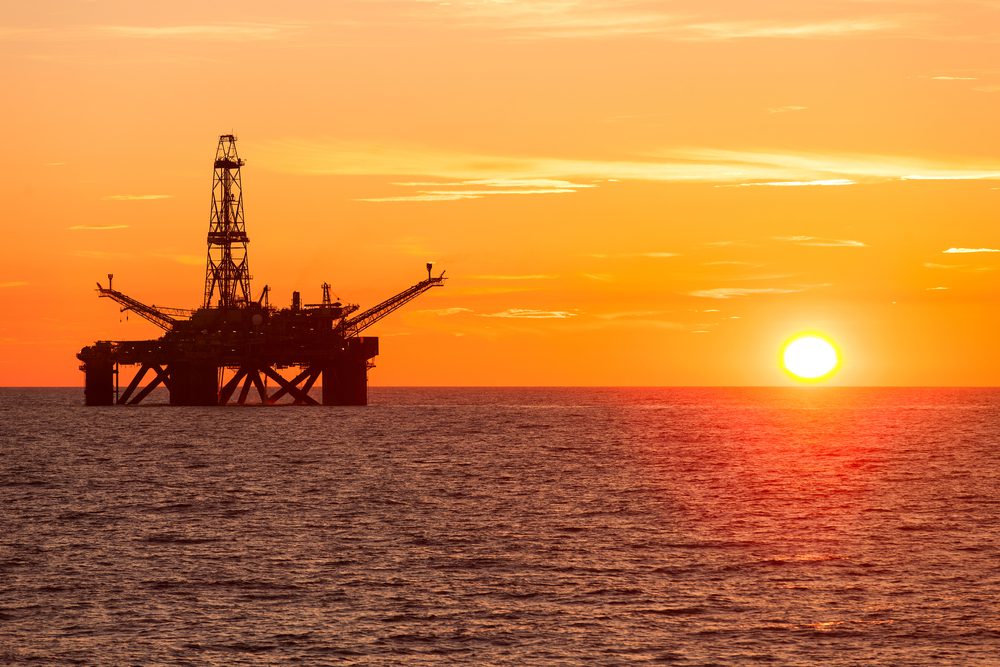
April 16 (Reuters) – The U.S. Interior Department on Friday sought to erase the Trump administration’s pro-fossil fuels legacy from the nation’s public lands by revoking a suite of policies...
By Valerie Volcovici and Jeff Mason WASHINGTON, Jan 27 (Reuters) – President Joe Biden was set on Wednesday to sign executive actions to combat climate change, including pausing new oil...
January 27, 2021
Total Views: 1316
Get The Industry’s Go-To News
Subscribe to gCaptain Daily and stay informed with the latest global maritime and offshore news
— just like 104,628 professionals
Secure Your Spot
on the gCaptain Crew
Stay informed with the latest maritime and offshore news, delivered daily straight to your inbox
— trusted by our 104,628 members
Your Gateway to the Maritime World!
Essential news coupled with the finest maritime content sourced from across the globe.

 Join The Club