A new State of the Climate report confirmed that 2020 was among the three warmest years in records dating to the mid-1800s, even with a cooling La Niña influence in the second half of the year. New high temperature records were set across the globe. The report found that the major indicators of climate change continued to reflect trends consistent with a warming planet. Several markers such as sea level, ocean heat content, and permafrost once again broke records set just one year prior. Notably, carbon dioxide (CO2) levels in the atmosphere also reached record highs in 2020, even with an estimated 6%–7% reduction of CO2 emissions due to the economic slowdown from the global pandemic.
The 31st annual issuance of the report, led by NOAA National Centers for Environmental Information, is based on contributions from more than 530 scientists from over 60 countries around the world and reflects tens of thousands of measurements from multiple independent datasets (highlights, full report). It provides a detailed update on global climate indicators, notable weather events and other datacollected by environmental monitoring stations and instruments located on land, water, ice and in space.
The report’s climate indicators show patterns, changes and trends of the global climate system. Examples of the indicators include various types of greenhouse gases; temperatures throughout the atmosphere, ocean, and land; cloud cover; sea level; ocean salinity; sea ice extent and snow cover.
Report highlights include these indications of a warming planet:
- Sea surface temperatures were near-record high. The globally averaged 2020 sea surface temperature was the third highest on record, surpassed only by 2016 and 2019, both of which were associated with El Niño conditions.
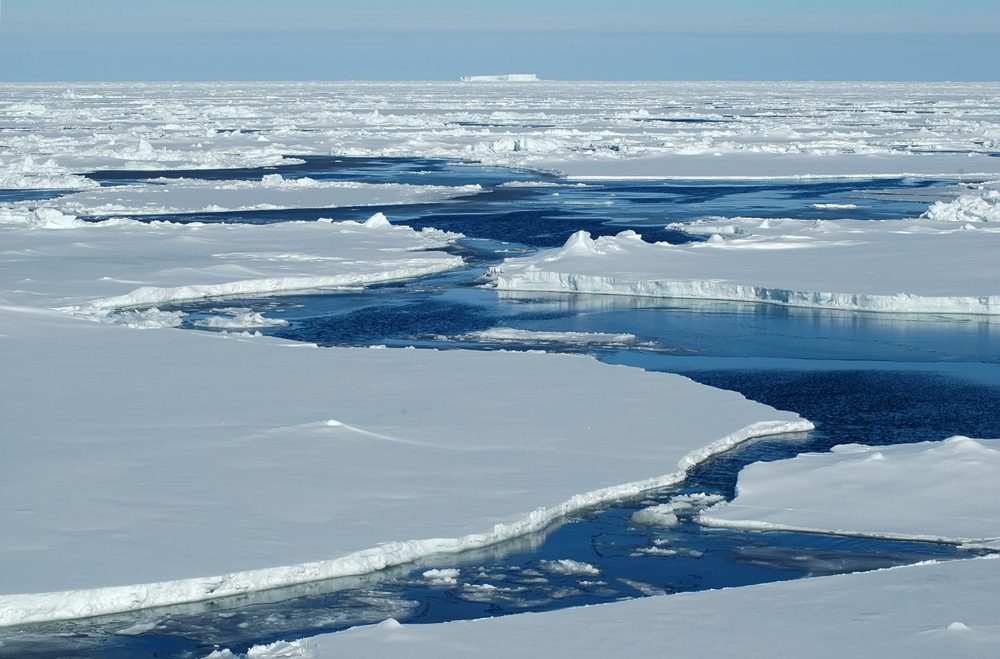
- Global upper ocean heat content was record high. Globally, upper ocean heat content reached record highs in 2020 in the upper layer measured from the surface to 2,300 feet (700 meters), according to four of the five datasets analyzed in the report. This record heat reflects the continuing accumulation of thermal energy in the top 2,300 feet of the ocean. Ocean heat content was also record high in the deeper layer beneath, from 700 to 2,000 meter depth, according to all five datasets. Oceans absorb more than 90% of Earth’s excess heat from global warming. The warmer upper ocean waters can drive stronger hurricanes and increase melting rates of ice sheet glaciers around Greenland and Antarctica.
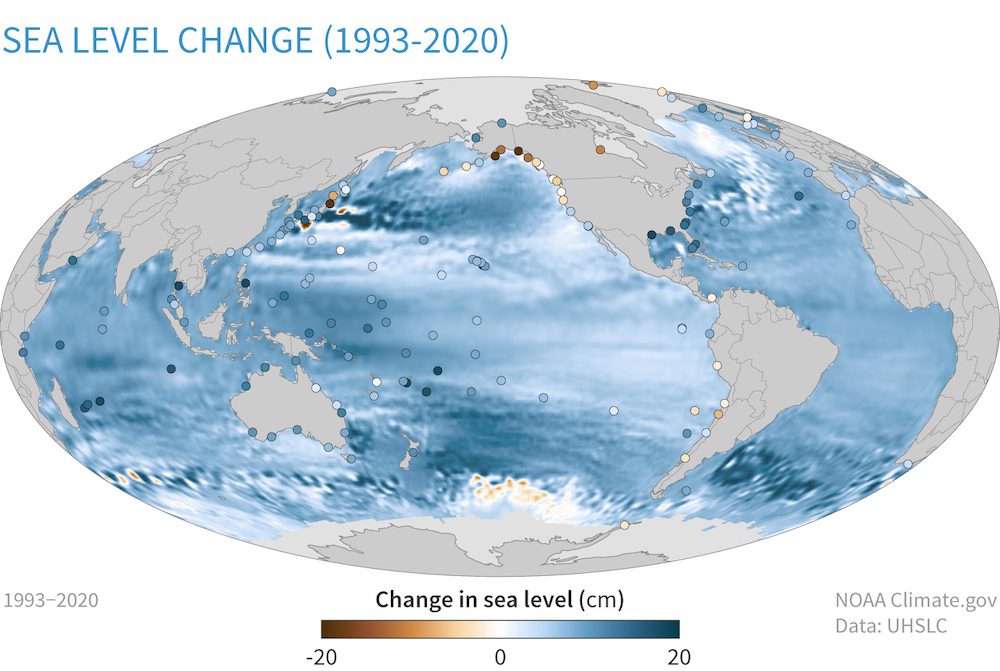
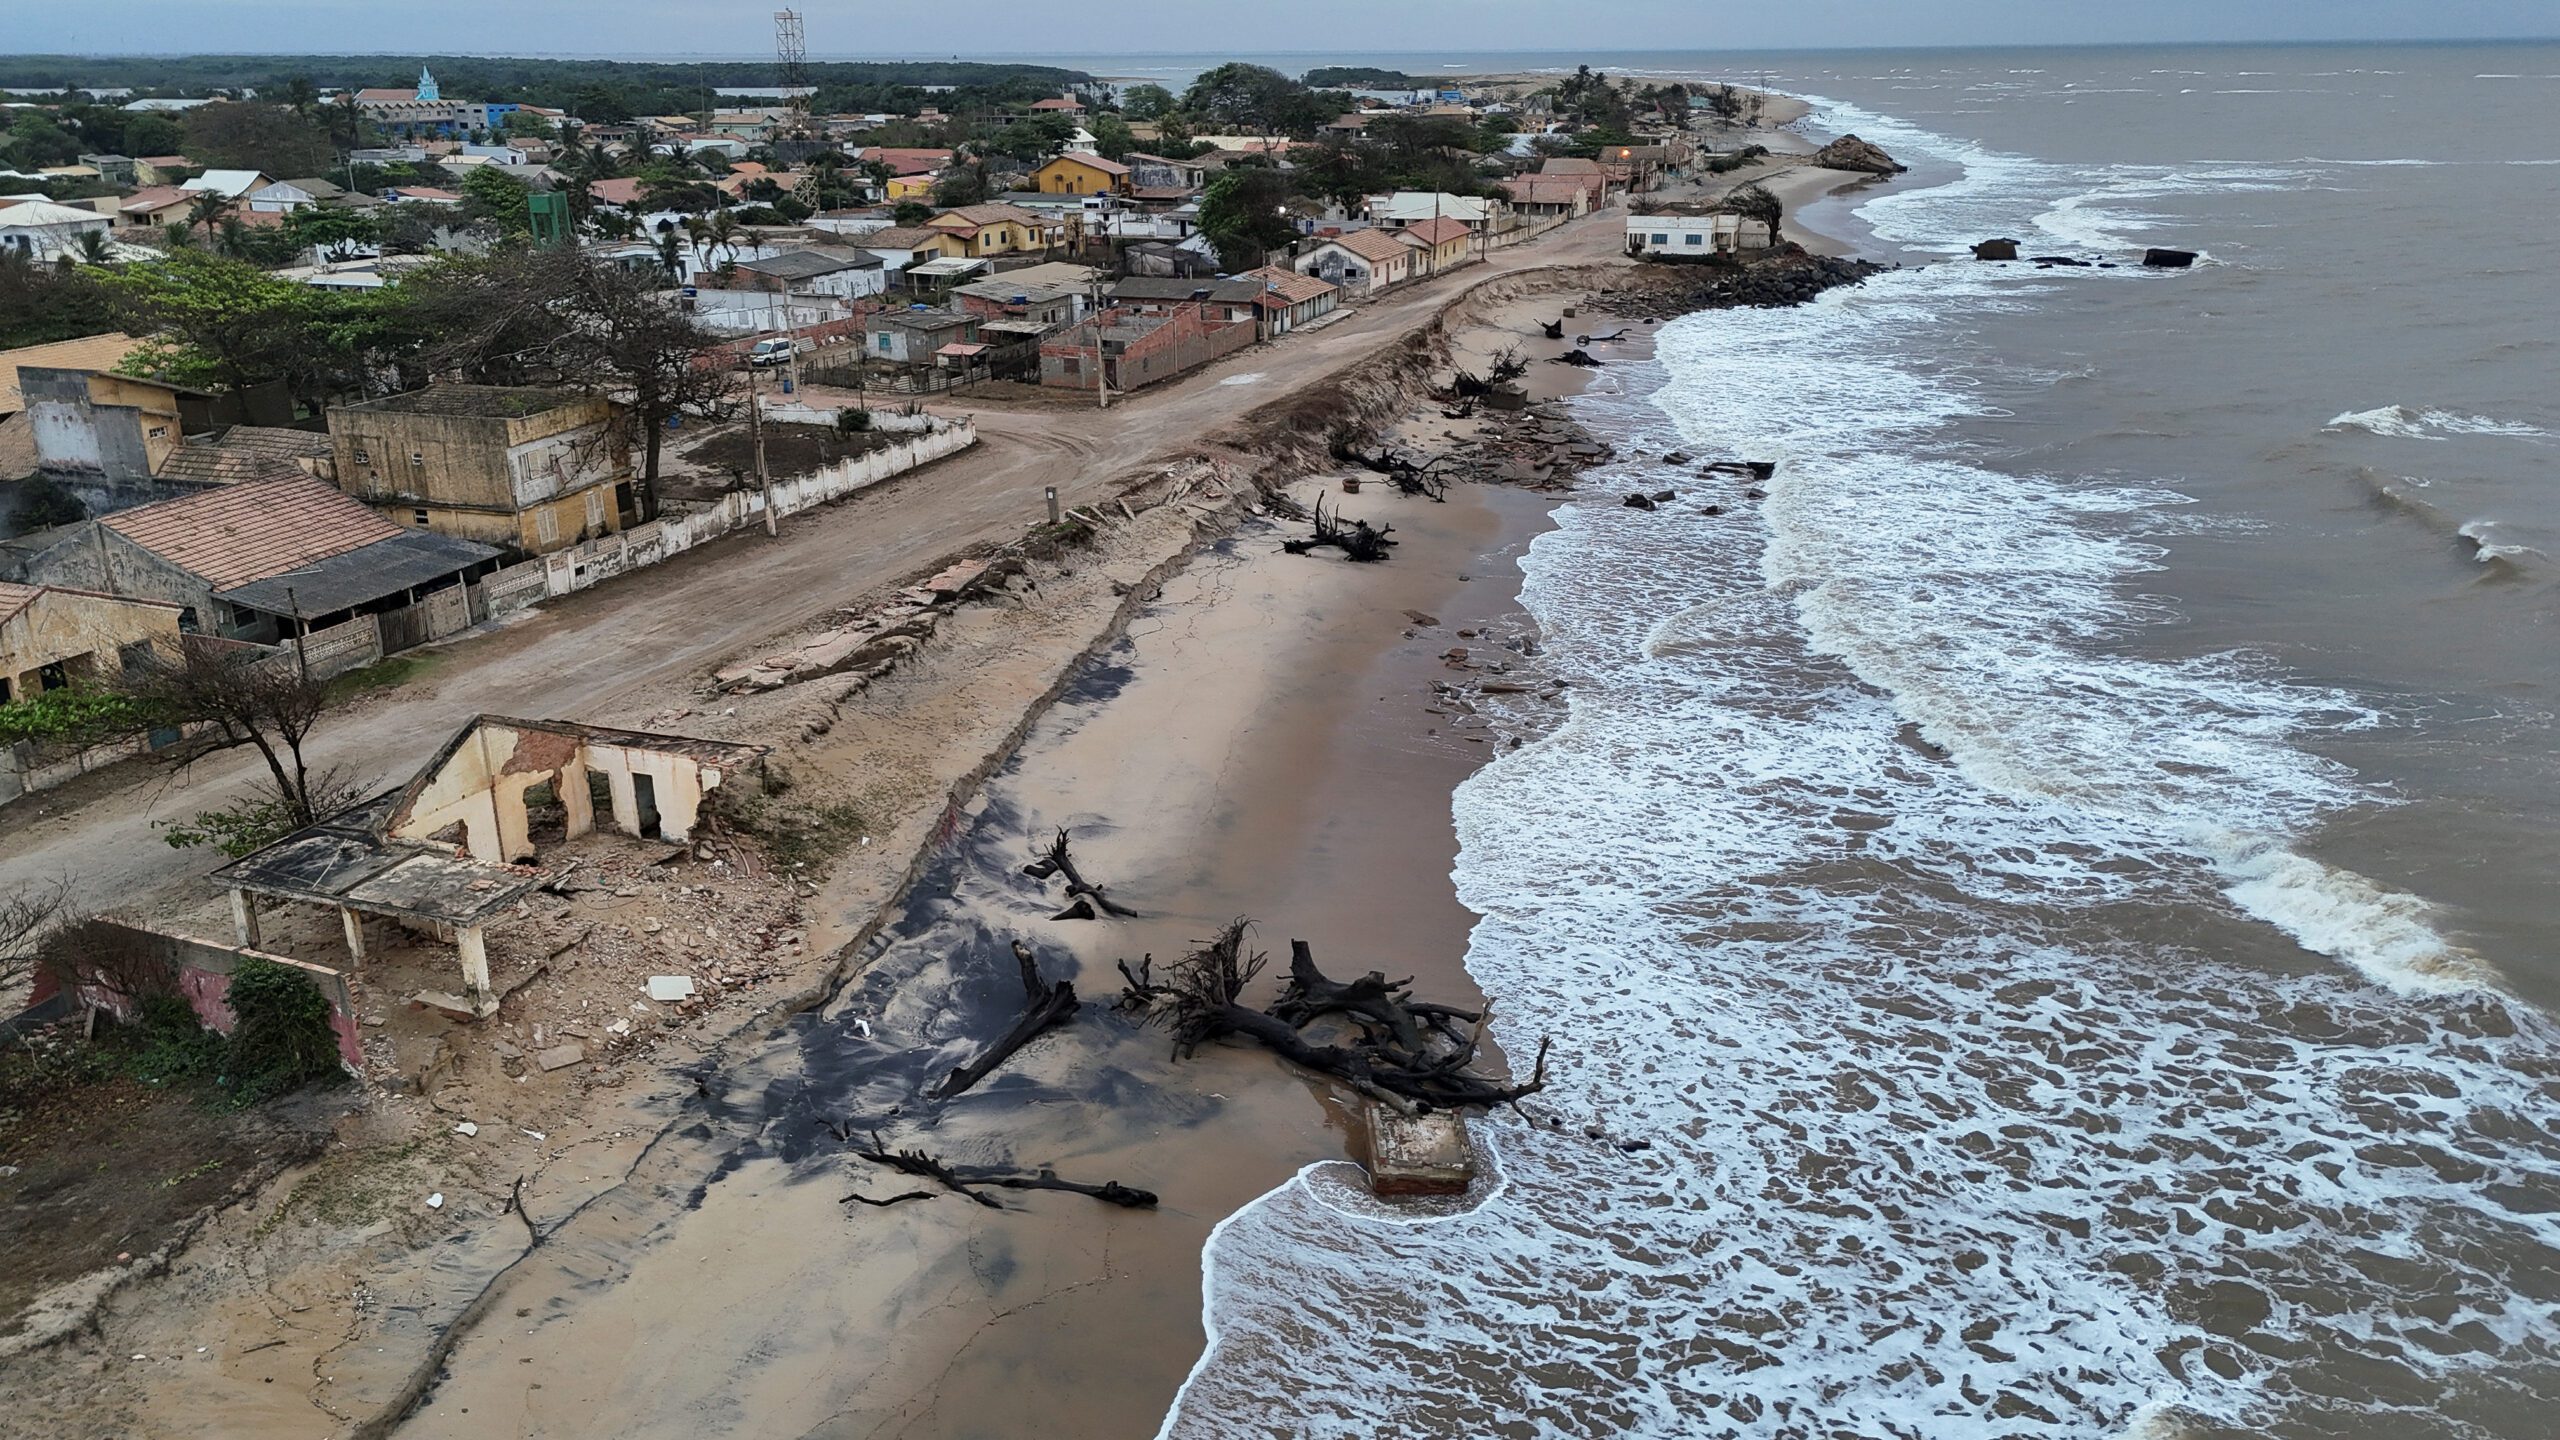
- Global sea level was highest on record. For the ninth consecutive year, global average sea level rose to a new record high and was about 3.6 inches (91.3 millimeter) higher than the 1993 average, the year that marks the beginning of the satellite altimeter record. Global sea level is rising at an average rate of 1.2 inches (3.0 centimeter) per decade due to changes in climate. Melting of glaciers and ice sheets, along with warming oceans, account for the trend in rising global mean sea level.
- Oceans absorbed a record amount of CO2.The ocean absorbed about 3.0 billion metric tons more CO2 than it released in 2020. This is the highest amount since the start of the record in 1982 and almost 30% higher than the average of the past two decades. More CO2 stored in the ocean means less remains in the atmosphere, but this also leads to increasing acidification of the waters, which can greatly harm or shift ecosystems.
- Tropical cyclones were well-above average overall. There were 102 named tropical storms during the Northern and Southern Hemisphere storm seasons, well above the 1981–2010 average of 85. Three tropical cyclones reached Saffir–Simpson scale Category 5 intensity. The North Atlantic hurricane basin recorded a record 30 named storms, surpassing the previous record of 28 in 2005. Seven of those storms became major hurricanes, matching 2005 for a record number. Major Hurricanes Eta and Iota made landfall along the eastern coast of Nicaragua in nearly the same location within a two-week period, impacting over seven million people across Central America. In the western North Pacific, Super Typhoon Goni was the strongest tropical cyclone to make landfall in the historical record and led to the evacuation of almost one million people in the Philippines. Very Severe Cyclonic Storm Gati made landfall over Somalia, the first storm of such intensity to do so.
The State of the Climate in 2020 is the 31st edition in a peer-reviewed series published annually as a special supplement to the Bulletin of the American Meteorological Society. The journal makes the full report openly available online.
This article originally appeared at NOAA’s National Center for Environmental Education
Editorial Standards · Corrections · About gCaptain

 Join The Club