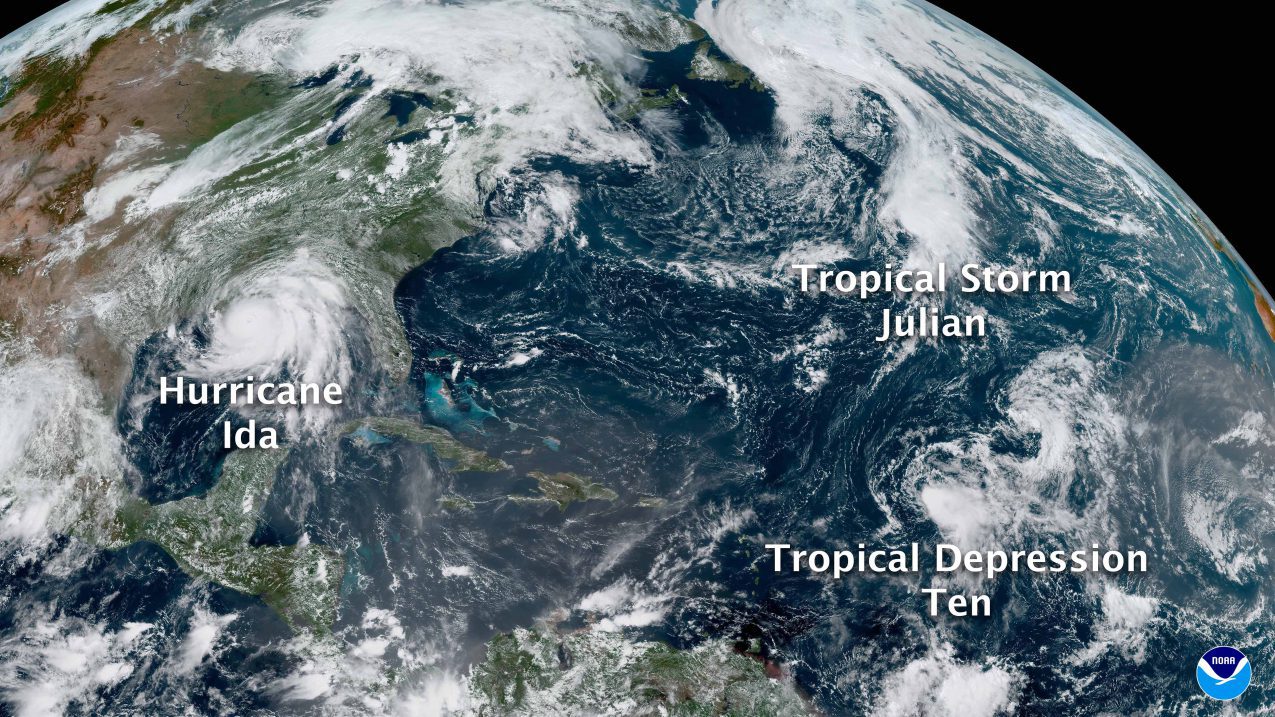
The 2021 Atlantic hurricane season officially ended this week having produced 21 named storms, including seven hurricanes of which four were major hurricanes with winds of 111 mph or greater.
This above-average hurricane season was in-line with forecasts from NOAA’s Climate Prediction Center, a division of the National Weather Service, in their May and August outlooks.
“NOAA provided the science and services necessary to protect life and property before, during and after storms all season long,” said NOAA Administrator, Rick Spinrad, Ph.D. “From essential observations to advanced warnings to critical response actions, NOAA supports communities so they are ready, responsive and resilient to the impact of tropical cyclones each and every hurricane season.”
The list of 21 named storms that have occurred during the 2021 Atlantic Hurricane Season. The season officially ends November 30. (NOAA)Download image
In terms of named storms, this year was the third most active year on record and marks the sixth consecutive above-normal Atlantic hurricane season. This was also the first time on record that two consecutive hurricane seasons exhausted the list of 21 storm names.
Based on a 30-year climate period from 1991 to 2020, an average Atlantic hurricane season has 14 named storms, 7 hurricanes, and 3 major hurricanes (Category 3, 4, or 5 on the Saffir-Simpson Hurricane Wind Scale).
Scientists attribute the heightened hurricane activity in recent years to the warm phase of the Atlantic Multidecadal Oscillation that began in 1995. The phenomenon, which favors more, stronger and longer-lasting storms, is thought to be driven by a combination of internal climate variability and changes over time in small airborne particles, often referred to as aerosols, over the North Atlantic, although uncertainties remain. The Intergovernmental Panel on Climate Change’s Sixth Assessment Report, released in August 2021, projects with high confidence that the global proportion of tropical cyclones that reach very intense (category 4-5) levels, along with their peak winds and rainfall rates, are expected to increase with climate warming at the global scale.
This infographic highlights key facts and statistics from the 2021 Atlantic Hurricane Season. The Atlantic hurricane season officially ends November 30, but storm activity in the tropics can sometimes continue beyond that date. (NOAA)
“The hard-working forecasters at NOAA’s National Weather Service weather and water forecast offices and national centers, along with the National Hurricane Center, provided reliable forecasts and advanced warnings around the clock to safeguard communities in the pathway of destructive storms throughout this active hurricane season,” said National Weather Service Director Louis W. Uccellini, Ph.D. “Their dedication and service are a recognized asset to the nation’s resilience to these extreme events.”
This season’s storm activity started early and quickly ramped up. It marked the seventh consecutive year with a named storm forming before the official start to the season on June 1, and held the earliest fifth named storm on record.
“Climate factors, which include La Niña, above-normal sea surface temperatures earlier in the season, and above-average West African Monsoon rainfall were the primary contributors for this above-average hurricane season,” said Matthew Rosencrans, lead seasonal hurricane forecaster at NOAA’s Climate Prediction Center.
NOAA’s hurricane research and observations
Another interesting development came when scientists at NOAA’s Atlantic Oceanographic and Meteorological Laboratory deployed five new extreme weather Saildrones to collect data at the ocean and atmosphere interface in the Caribbean and western tropical Atlantic. One of the drones actually captured the first ever video and measurements at the surface of the ocean during a major hurricane, withstanding 125-mph winds and 50-foot waves during Hurricane Sam. The data collected, combined with data from other Saildrones, ocean gliders and aircraft-released sensors, is helping NOAA to better represent the conditions that drive hurricanes within forecast models.
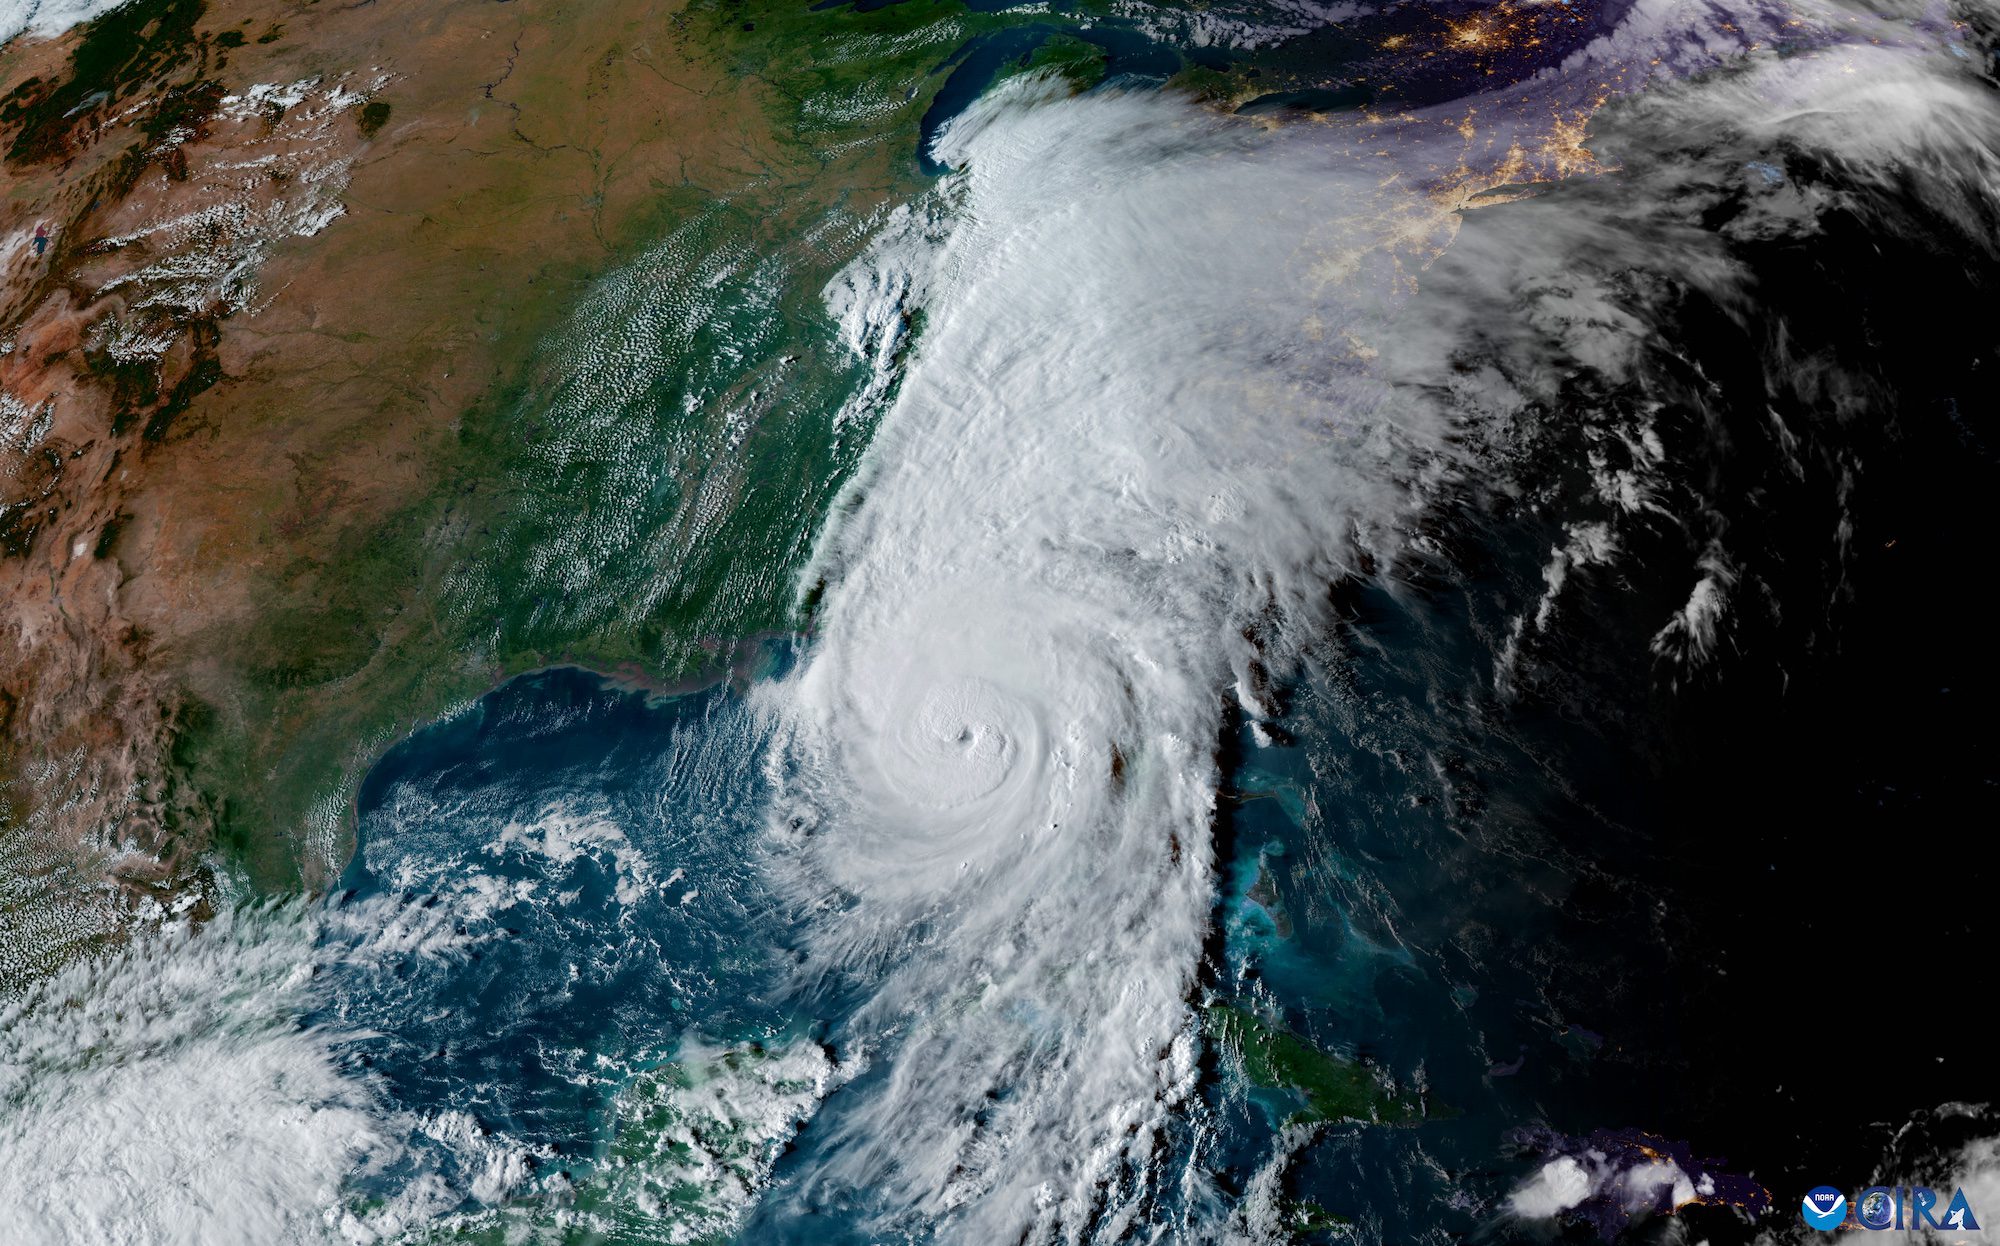
NOAA aircraft flew more than 462 mission hours to support hurricane forecasting and research to help forecasters make accurate storm predictions. Thanks to data from these aircraft, NOAA satellites, and other sources, the National Hurricane Center accurately forecasted Hurricane Ida — which is tied for the fifth strongest hurricane to ever make landfall in the United States — hitting Louisiana as a major hurricane. Ida dealt the biggest blow to U.S. energy production since Hurricane Katrina in 2005.
Since the launch of the storm surge warning and new inundation mapping in 2017, there have been 16 U.S hurricane landfalls, of which seven were major hurricanes. During this period, there are only seven known direct fatalities attributed to storm surge in the United States. In 2021, only one life was lost due to the storm surge accompanying the eight landfalling storms.
In the aftermath of Hurricane Ida, NOAA Aircraft flew 32 mission hours collecting aerial damage assessment images to support emergency response efforts at NOAA’s National Ocean Service. NOAA’s aerial imagery aids safe navigation and is a critical tool in determining the extent of damage inflicted by flooding and assessing damage to major ports and waterways, coastlines, critical infrastructure and coastal communities.
By Danielle Bochove Jul 24, 2025 (Bloomberg) –The world’s oceans experienced a staggering amount of warming in 2023, as vast marine heat waves affected 96% of their surface, breaking records for intensity, longevity...
By Valerie Volcovici April 11 (Reuters) – The administration of President Donald Trump aims to eliminate the arm of the National Oceanic and Atmospheric Administration that oversees research on climate change and refocus the U.S....
The National Hurricane Center (NHC) achieved unprecedented accuracy in hurricane track forecasting during the 2024 Atlantic hurricane season, according to a preliminary forecast verification review by the National Weather Service....
March 7, 2025
Total Views: 158
Get The Industry’s Go-To News
Subscribe to gCaptain Daily and stay informed with the latest global maritime and offshore news
— just like 105,985 professionals
Secure Your Spot
on the gCaptain Crew
Stay informed with the latest maritime and offshore news, delivered daily straight to your inbox
— trusted by our 105,985 members
Your Gateway to the Maritime World!
Essential news coupled with the finest maritime content sourced from across the globe.

 Join The Club


")
")