Satellite observations of nitrogen dioxide near key U.S. ports suggest that increased shipping activity and backlogs may be affecting air quality.
Congestion at the United States’ busiest ports has been blamed for everything from supply chain snarls to inflation and even an oil spill. Scientists say the backlogs may now also be causing higher air pollution.
Atmospheric scientists have been analyzing air pollution data from satellites to find out whether the unusually high shipping activity over the last year and half has been impacting air quality near American ports.
While there are various contributors at play, a preliminary look at satellite observations show elevated concentrations of nitrogen dioxide pollution near the three busiest ports in the country, suggesting that ships may be the cause.
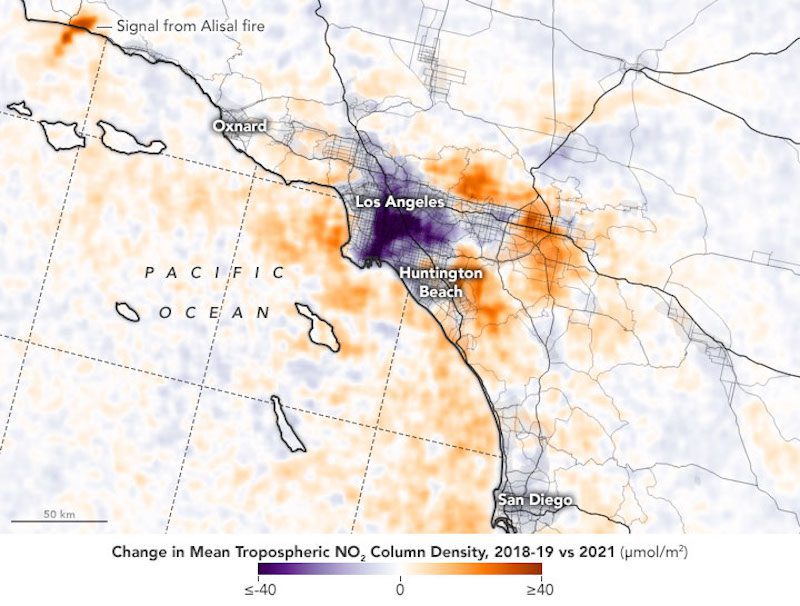
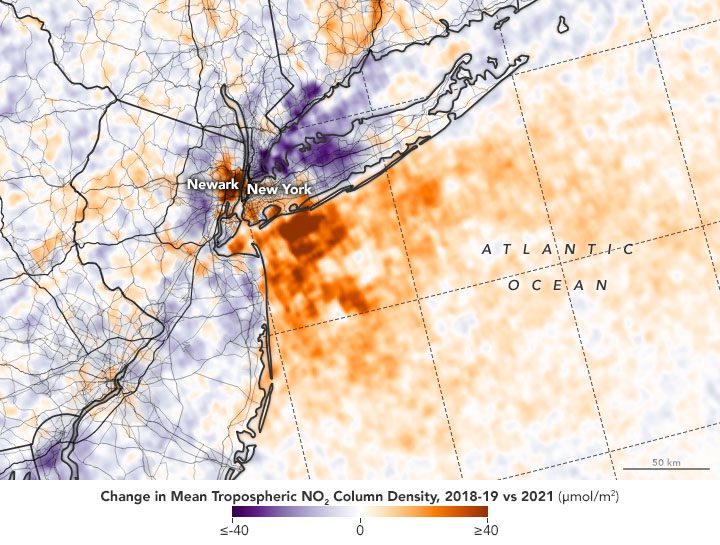
NASA’s Earth Observatory has released maps showing the concentration of NO2 over three weeks in October, compared to the same period in 2019 and 2018. The maps show the busiest ports in the U.S. – the ports of Los Angeles, Long Beach and New York/New Jersey – all had elevated concentrations of the air pollutant.
Credit: NASA Earth Observatory
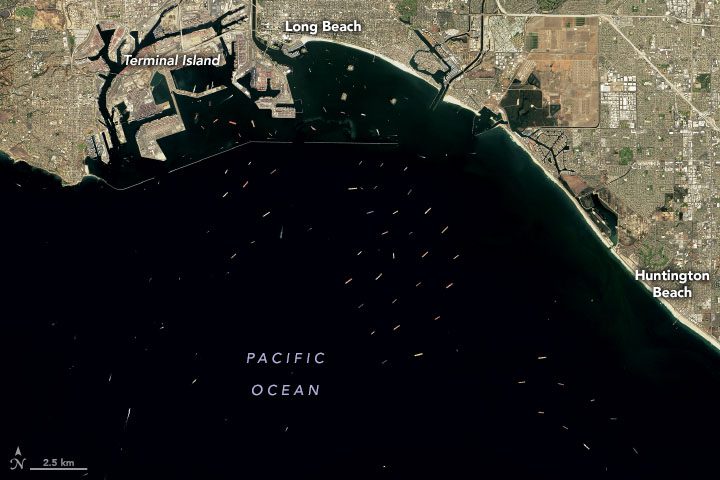
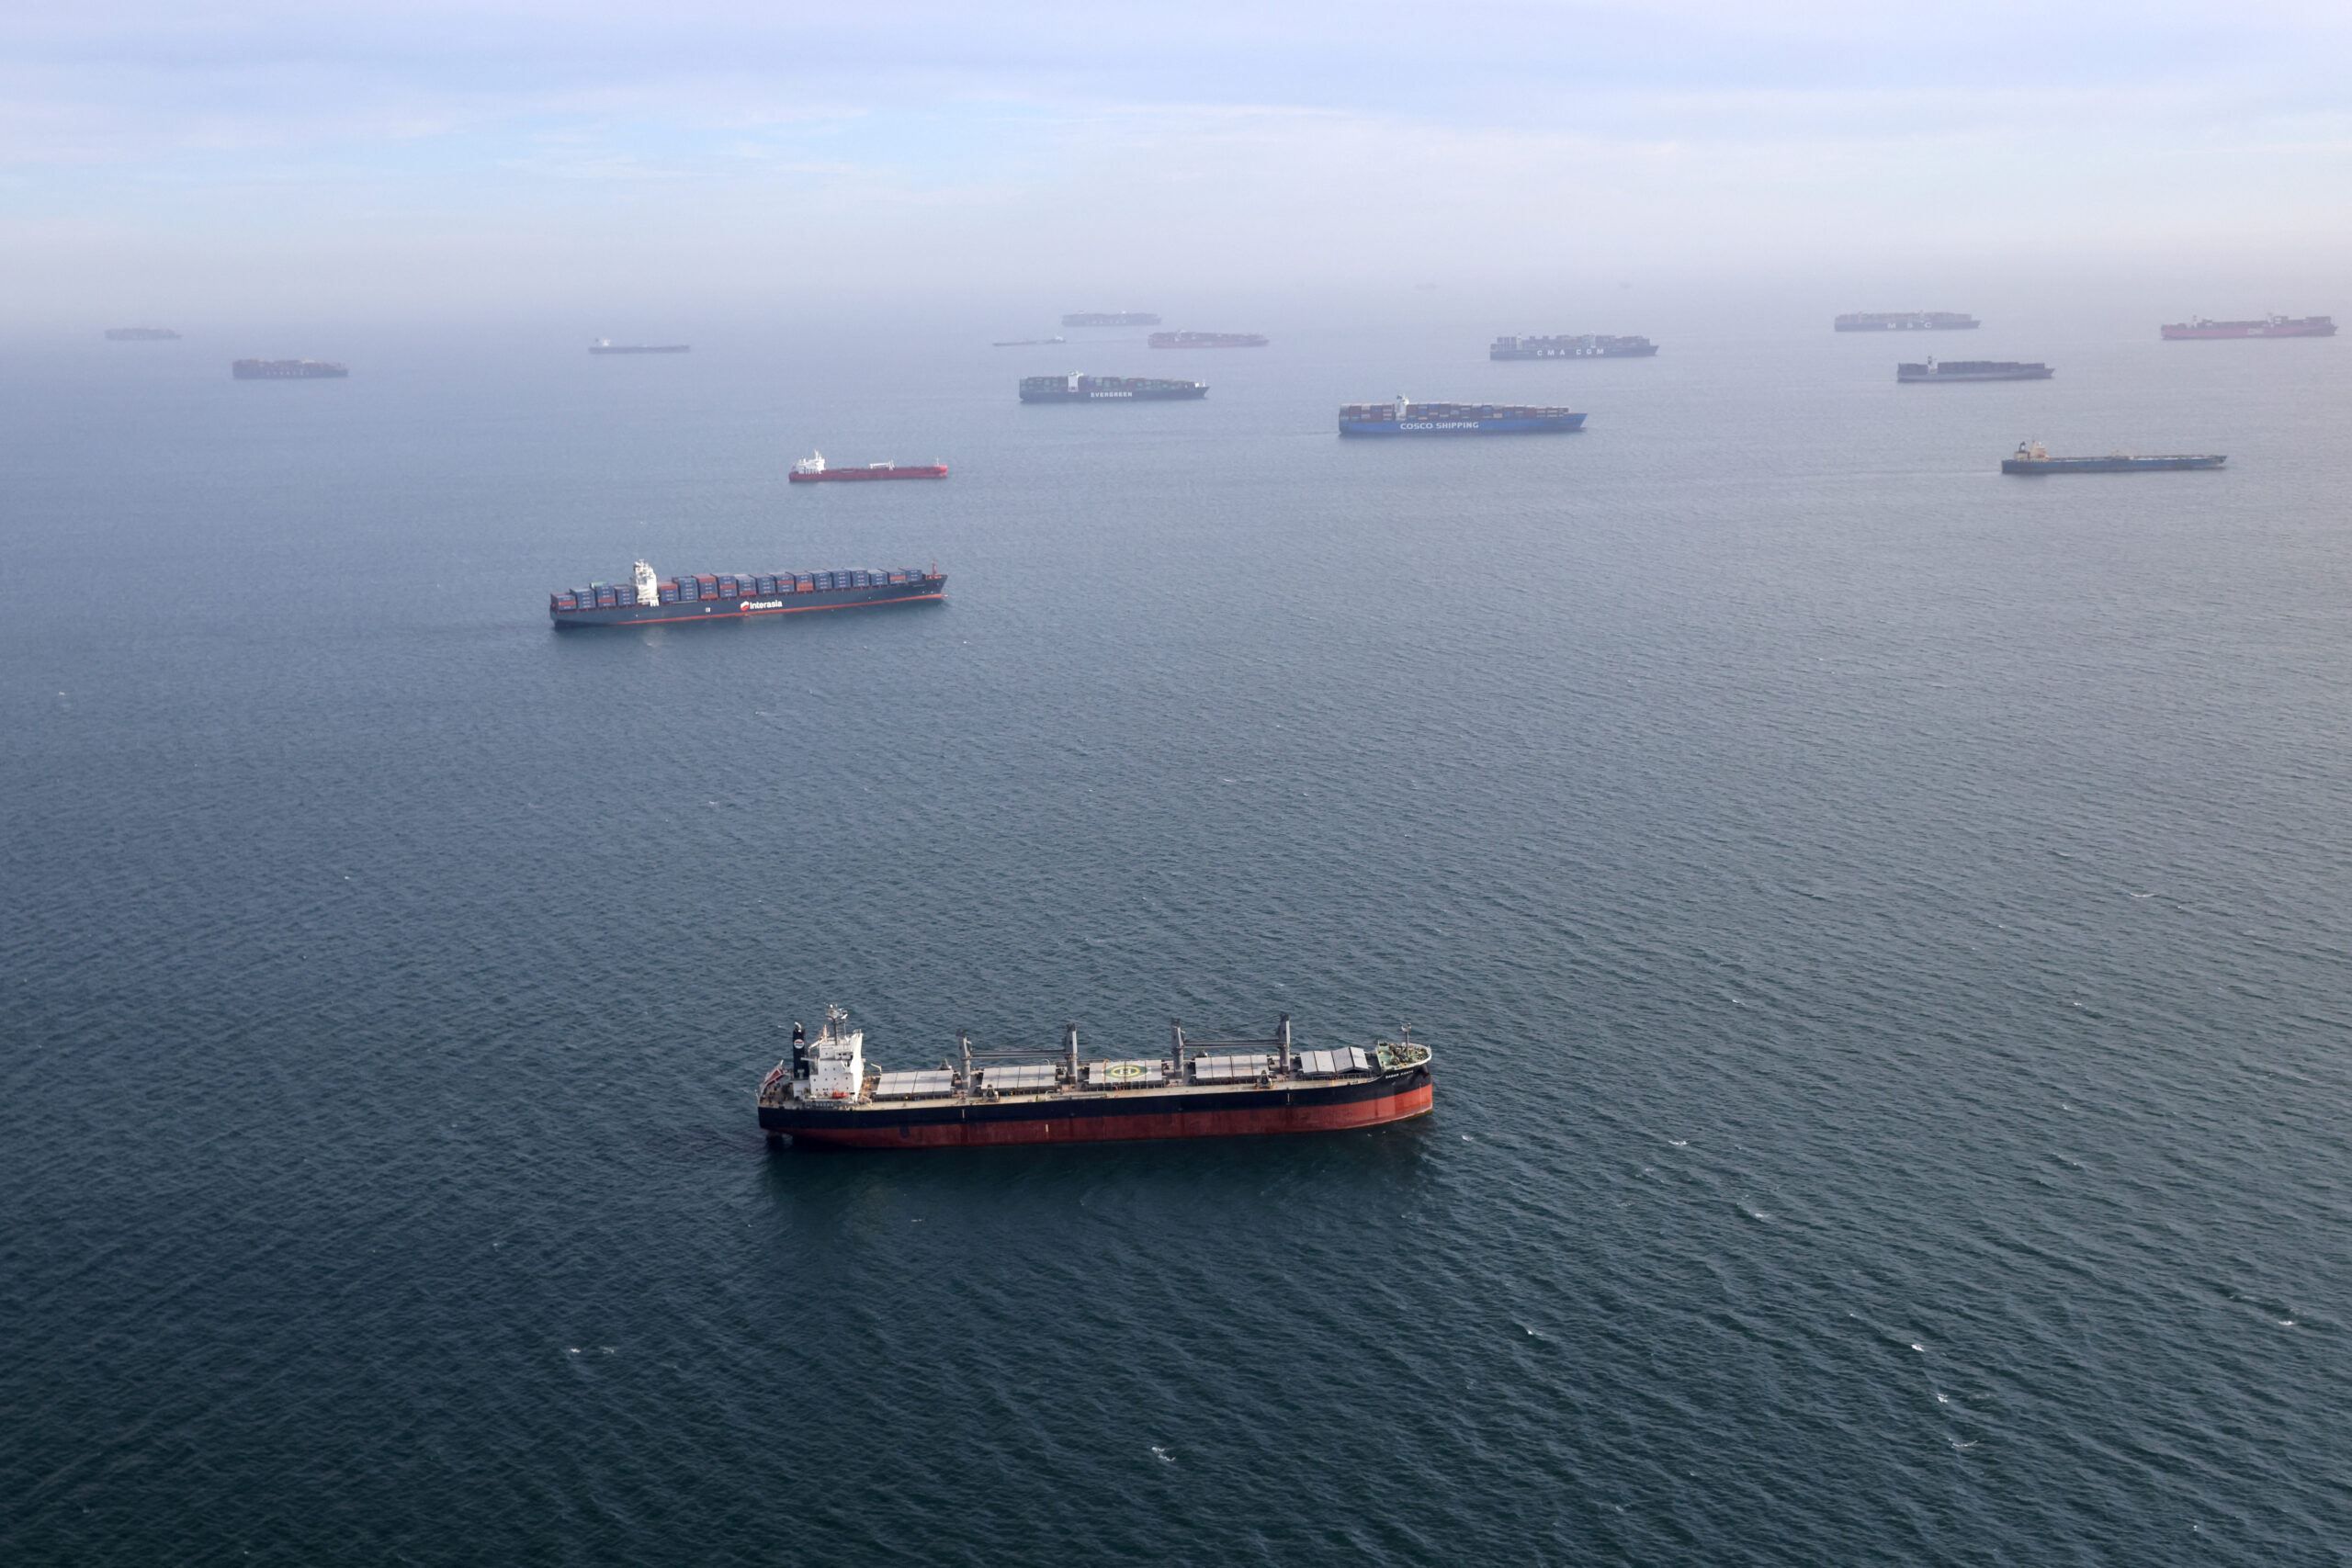
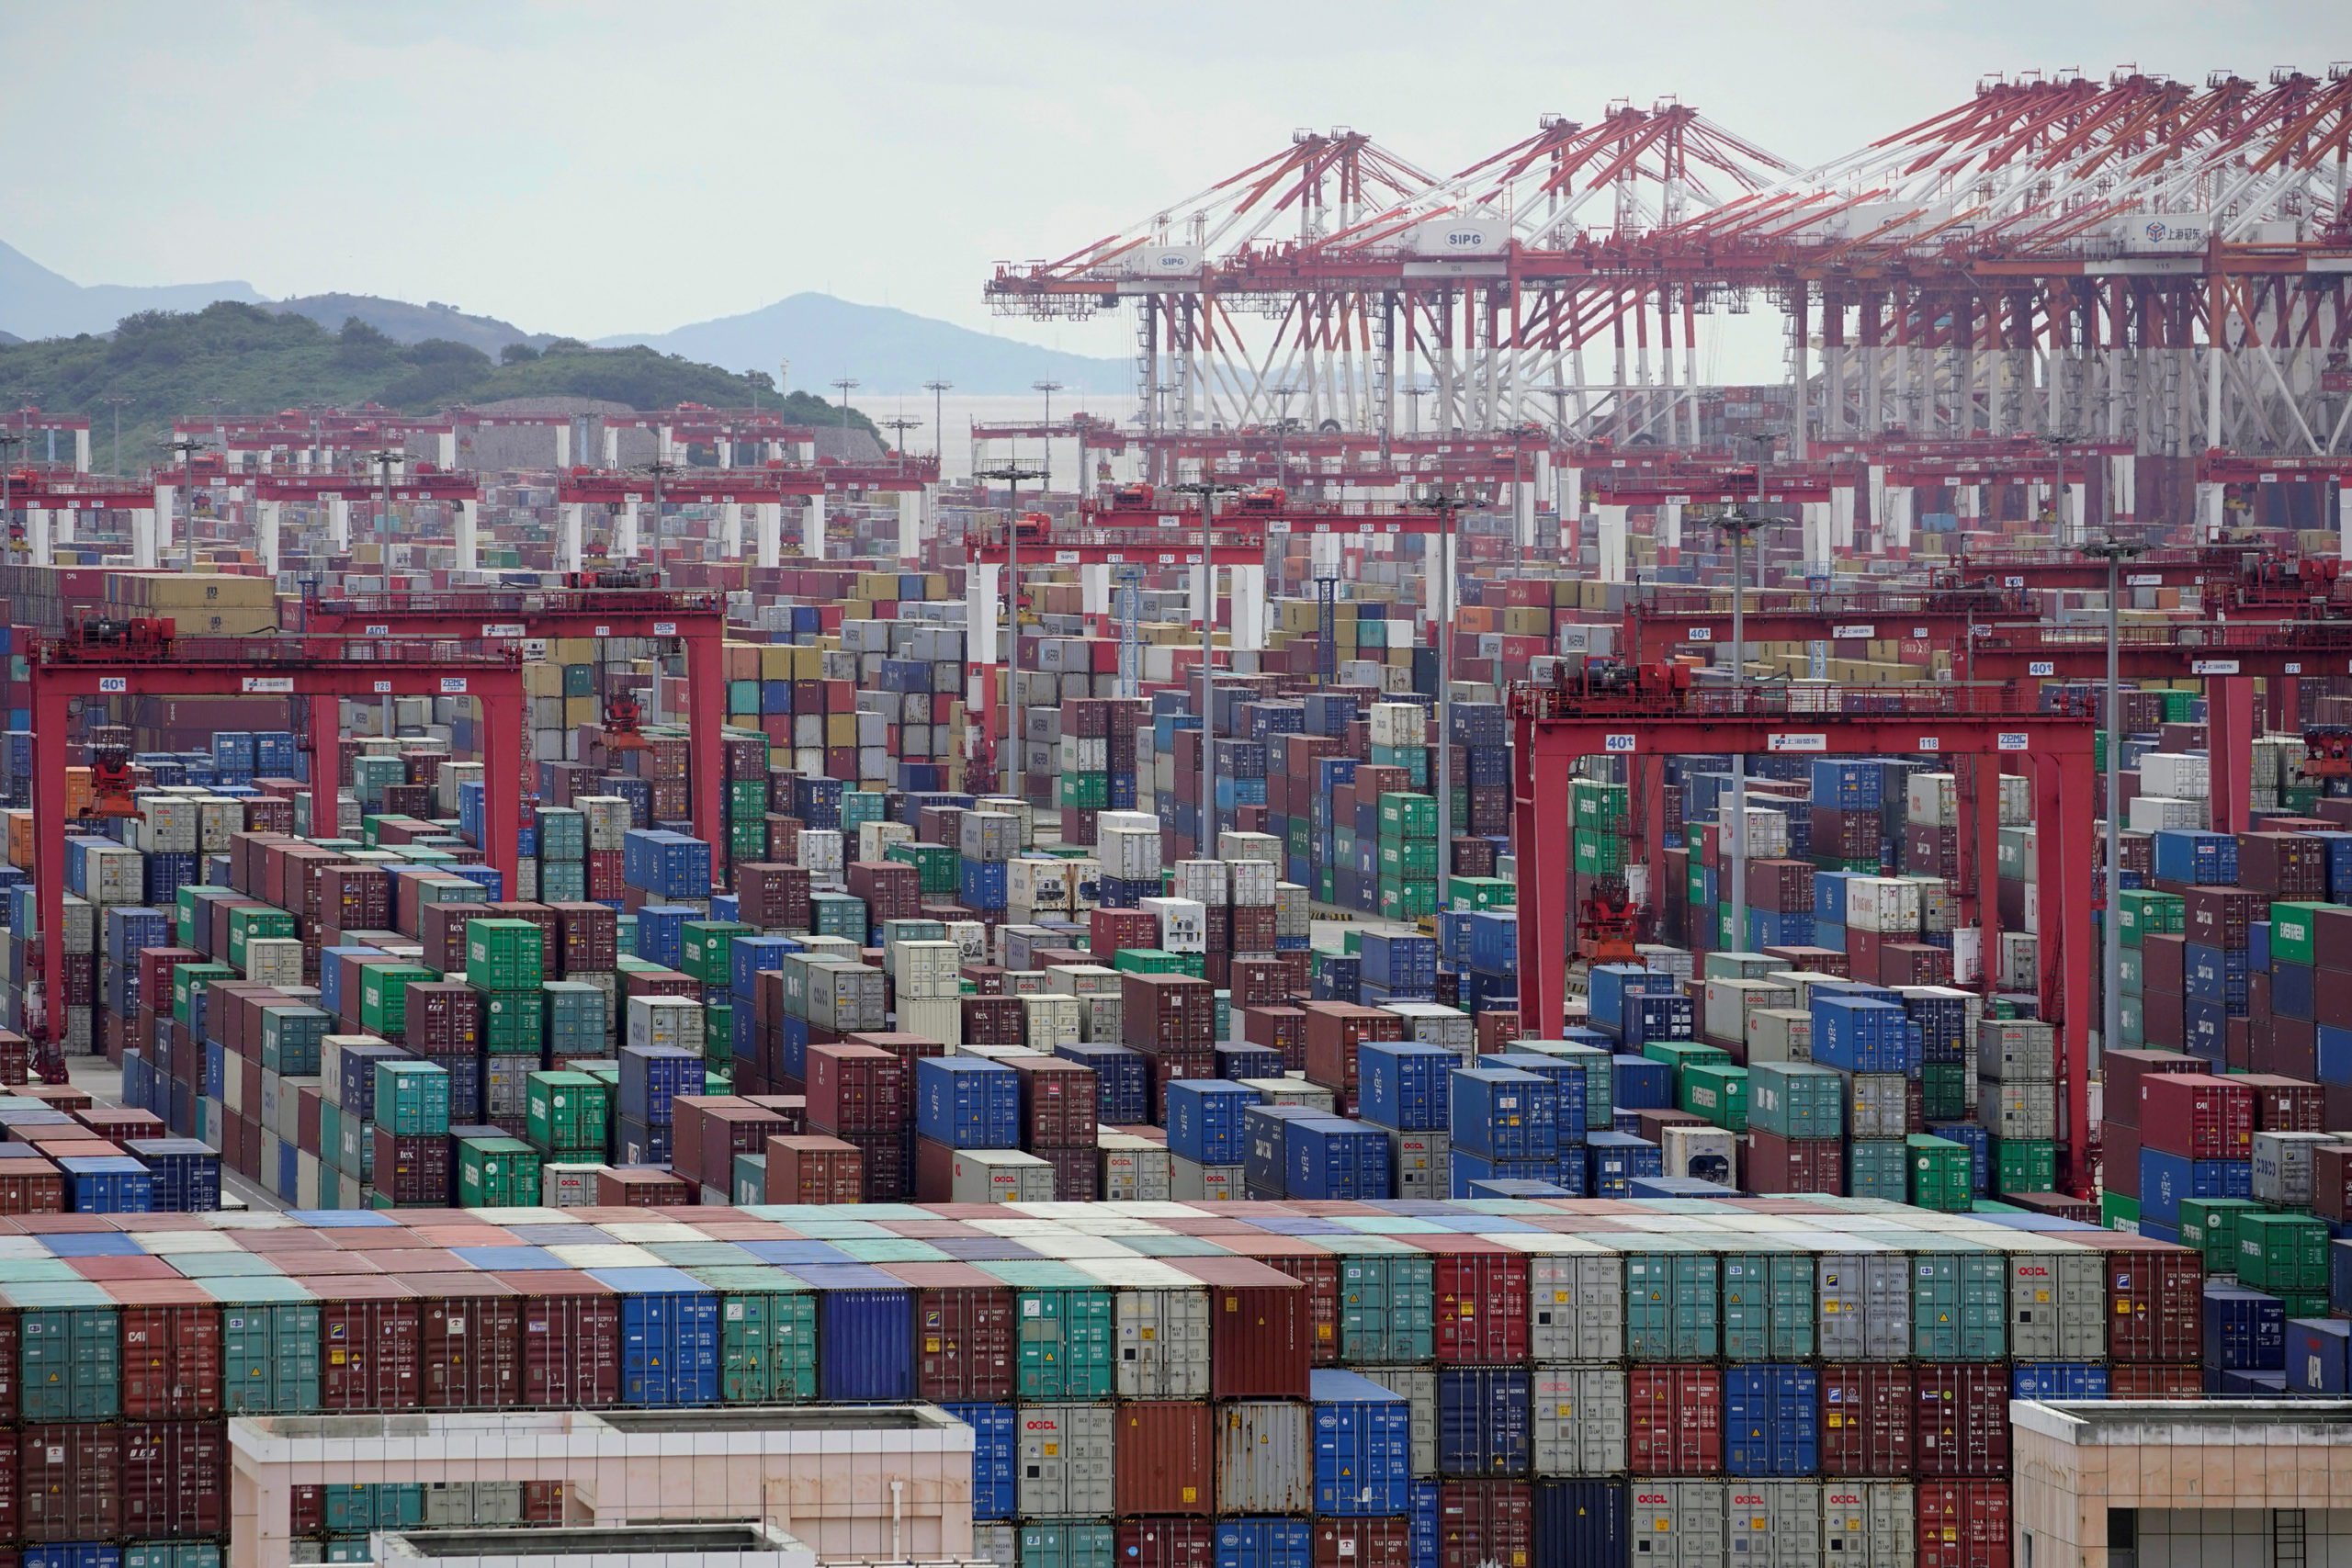
According to the Marine Exchange of Southern California, which operates the vessel traffic services for the San Pedro Bay area, the neighboring ports of Los Angeles and Long Beach saw a record of over 150 ships in port per day in October, including over 100 at any given time at anchorages and in offshore holding areas. While backups at the Port of New York and New Jersey have not been as bad, the port has also been experience higher-than-usual shipping activity since the imports began rebounding from the initial COVID-19 shutdowns.
Satellite image from October 10, 2021. Credit: NASA
While the Earth Observatory notes a number of industries and processes play a role in NO2 levels, the data suggests that the increased number of ships are at least partly to blame.
“The blue spot over downtown Los Angeles may be the result of fewer people commuting into offices downtown and working remotely instead,” said Daniel Goldberg, an atmospheric scientist at George Washington University. “When you are looking at satellite data showing changing concentrations of pollution, you always have to keep in mind that there are multiple factors at play that can be hard to disentangle.”
Nitrogen dioxide falls into a group of highly-reactive nitrogen oxide emissions, known as NOx, that can lead to the production of fine particles and ozone that can be extremely hazardous to human health. While regulations have sought to limit NOx emissions from ships, combustion engines continue to be a major source of NO2 pollution.
The data was collected by the Tropospheric Monitoring Instrument (TROPOMI) on the European Commission’s Copernicus Sentinel-5P satellite, built by the European Space Agency.
A new report from the World Bank and S&P Global Market Intelligence argues that ports are no longer merely victims of supply chain disruptions—they are increasingly active participants in determining...
The U.S. National Science Foundation (NSF) has begun a major downsizing of one of the world’s largest ocean observing networks, announcing plans to remove most of the in-water infrastructure associated...
Multiple sources of trade data are showing the significant impact of the U.S.-Israel war on Iran and how it is going to continue to get worse before it gets better.
March 24, 2026
Total Views: 2383
Get The Industry’s Go-To News
Subscribe to gCaptain Daily and stay informed with the latest global maritime and offshore news
— just like 104,677 professionals
Secure Your Spot
on the gCaptain Crew
Stay informed with the latest maritime and offshore news, delivered daily straight to your inbox
— trusted by our 104,677 members
Your Gateway to the Maritime World!
Essential news coupled with the finest maritime content sourced from across the globe.

 Join The Club