SINGAPORE, July 19 (Reuters) – Marine fuel sales at the United Arab Emirates’ Fujairah, third largest bunkering hub in the world, fell to a four-month low in June as high bunker premiums and tight supplies capped uptake.
Total bunker sales volumes were down 13% month-on-month at 647,184 cubic metres (about 619,602 tonnes) in June, based on latest data from the Fujairah Oil Industry Zone published by industry information service S&P Global Commodity Insights.
“Fujairah barges have been trading above Singapore since mid-June. Both bunkering hubs have been experiencing a shortage of low-sulfur blend components which is creating tightness in the physical market,” said Timothy France, MENA senior oil analyst at Refinitiv Oil Research.
“Higher bunker premiums appear to be weighing on demand. Refinitiv shiptracking data indicates a slowdown in bunker sales through late June and July,” he added.
Combined low-sulphur bunker sales in June sank 13% to 514,494 cubic meters from May, while its market share of overall bunker volumes was steady from May at 79%.
Meanwhile, sales of 380-cst high-sulphur fuel oil (HSFO) fell 14% from May to 132,690 cubic meters in June, making up 21% out of overall bunker volumes.
The trend was in line with lower monthly sales at top bunkering hub Singapore, when marine fuel sales for June fell to a two-month low as high premiums for low-sulphur bunker fuel diverted demand to other bunkering ports.
Total volumes by month:
2022
Total bunker sales (in cu m)
m-o-m % change
Jan
646,089
0%
Feb
612,388
-5%
Mar
691,141
13%
Apr
664,870
-4%
May
745,064
12%
Jun
647,184
-13%
Breakdown by grade for current month:
2022
Total low sulphur bunker sales
m-o-m % change
180cst LSFO
380cst LSFO
MGO
LSMGO
380cst HSFO
m-o-m % change
Lubricants
m-o-m % change
Jan
526,342
0%
288
497,670
1,215
27,169
119,747
–
5,341
–
Feb
486,999
-7%
150
462,035
1,395
23,419
125,389
5%
5,234
-2%
Mar
561,848
15%
369
527,677
1,096
32,706
129,293
3%
5,469
4%
Apr
548,249
-2%
1,084
512,565
1,873
32,727
116,621
-10%
5,193
-5%
May
590,343
8%
453
555,151
1,087
33,652
154,721
33%
5,713
10%
Jun
514,494
-13%
372
482,926
1,287
29,909
132,690
-14%
5,036
-12%
(Reporting by Jeslyn Lerh; Editing by Rashmi Aich)
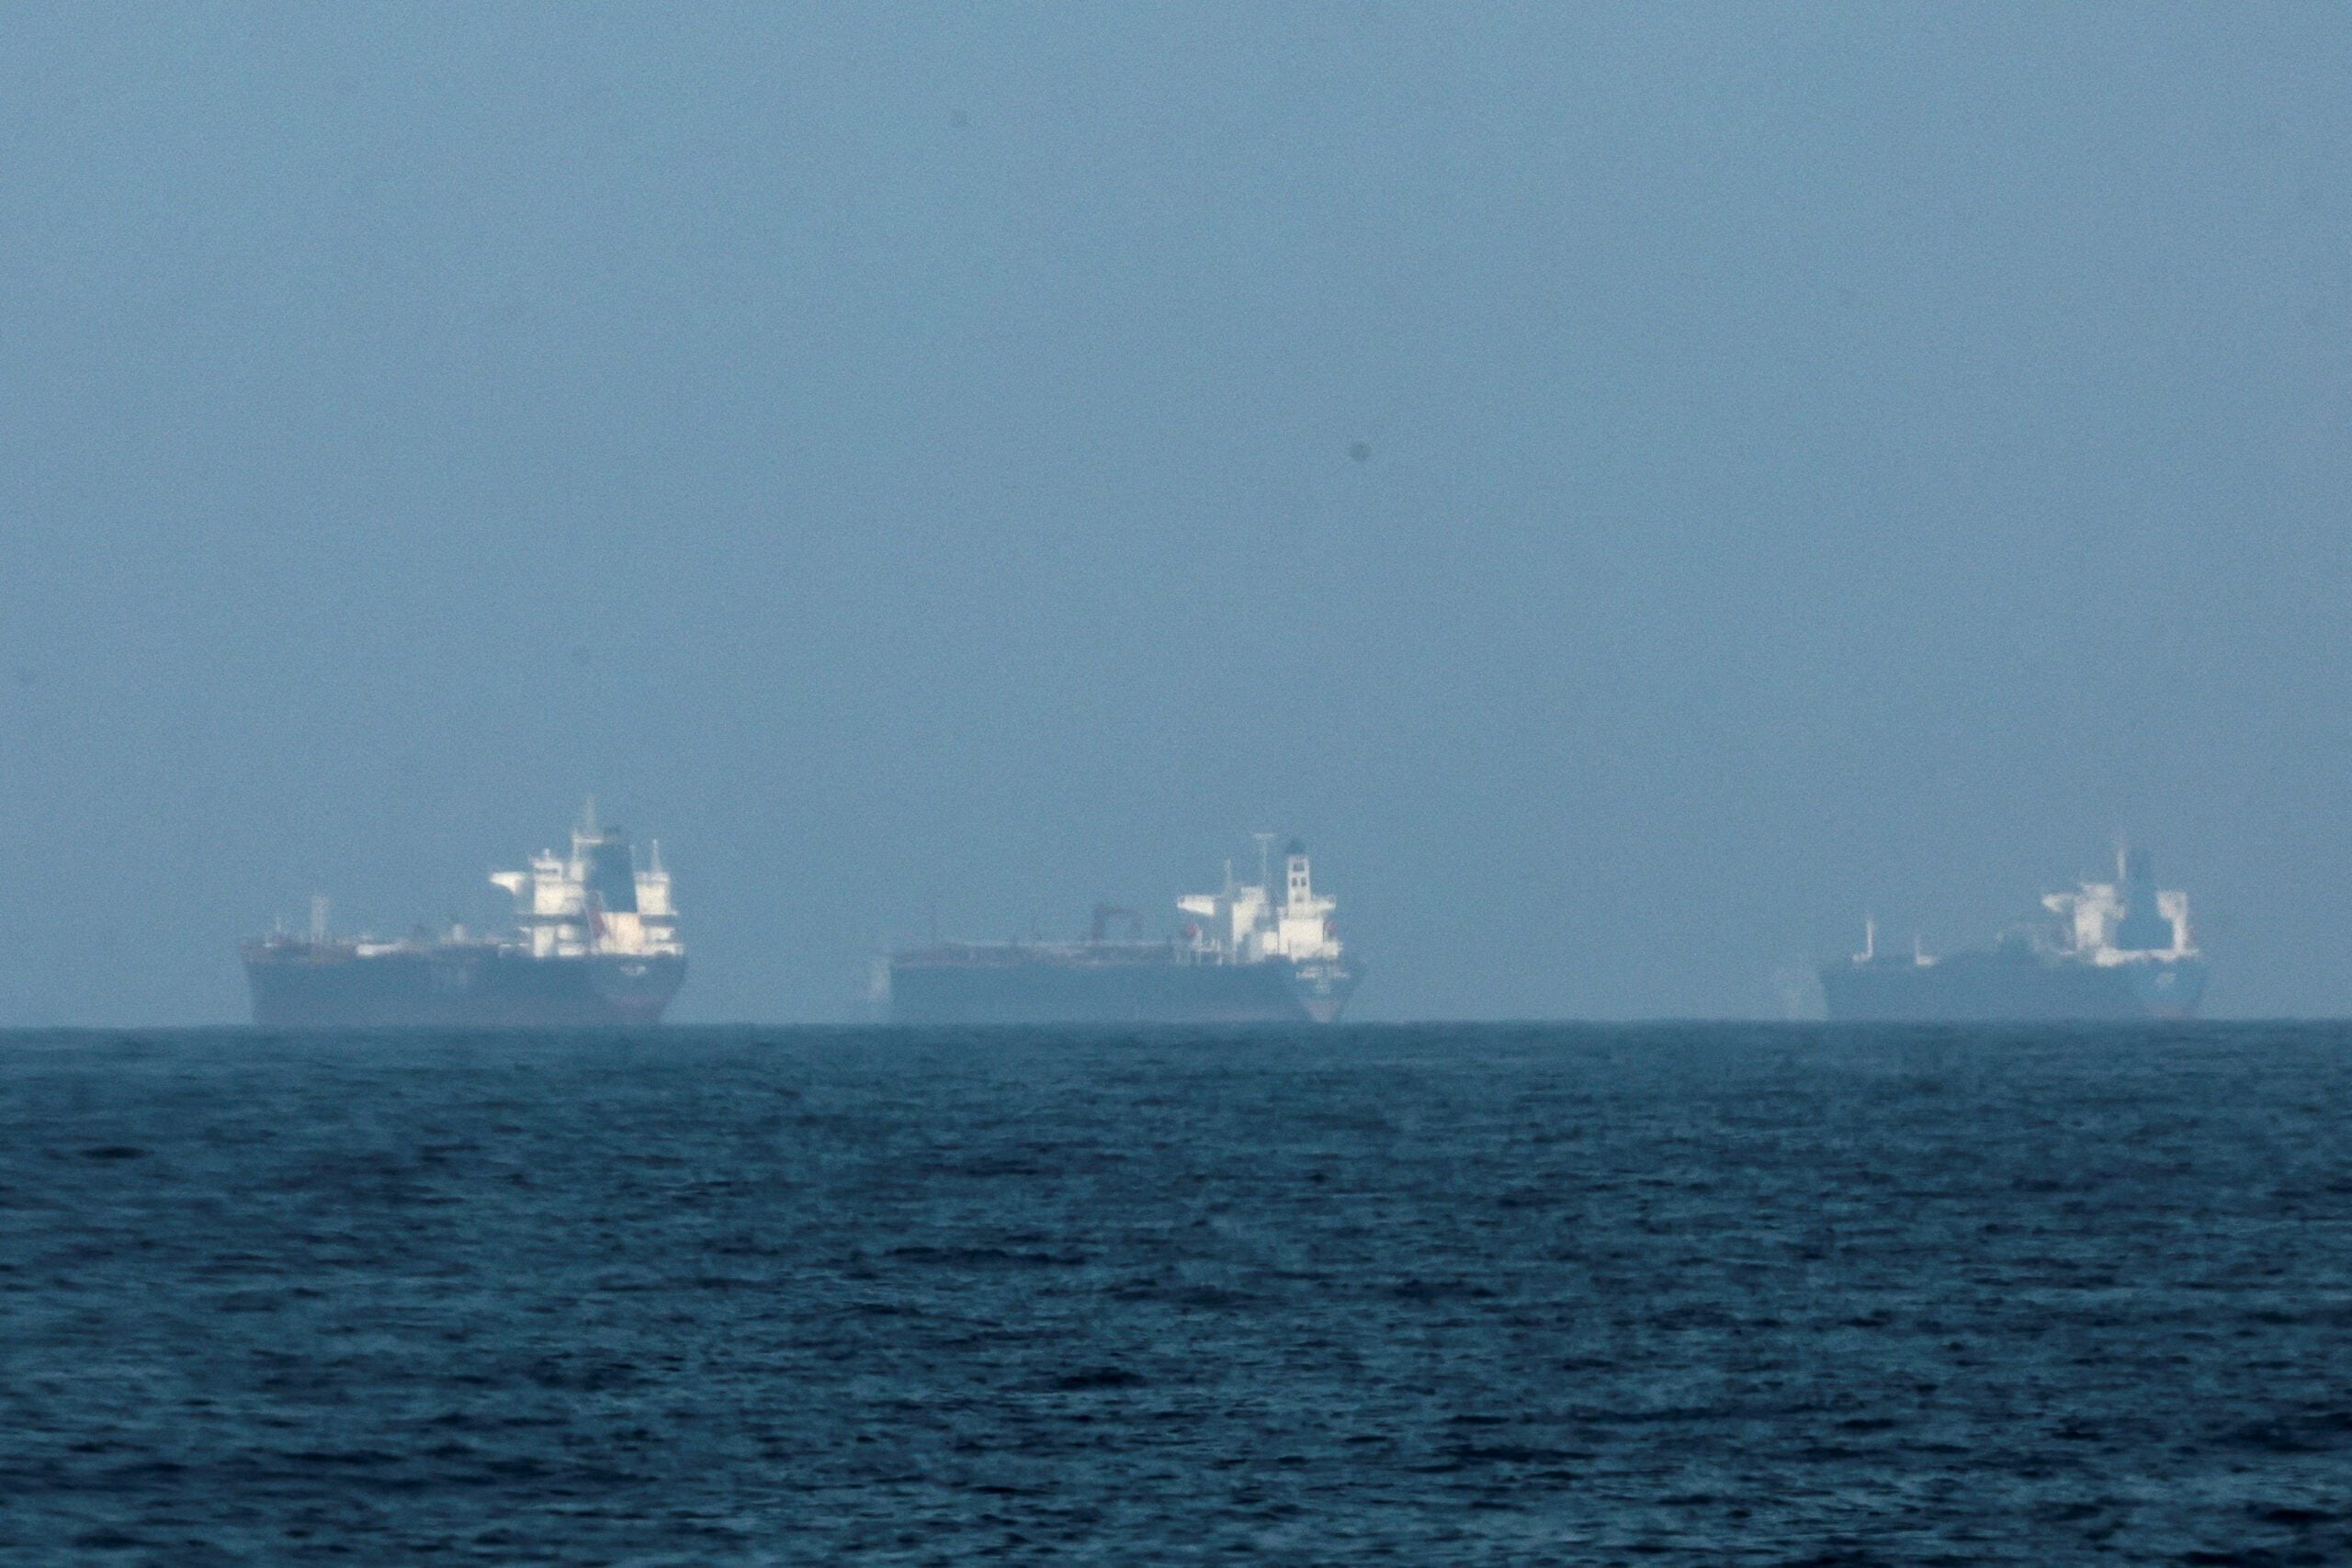
Just a few weeks into the war, one of the Persian Gulf’s top oil producers quietly began sneaking its crude out of the Strait of Hormuz. Before long, the covert project became so successful that the United Arab Emirates was already approaching its pre-war rate of flows through the waterway by the time the US and Iran signed their interim peace deal.
DUBAI, July 5 (Reuters) – Maritime trade between Iran and Qatar has resumed after a roughly five-month suspension, Iran’s commercial attaché in Doha told state media on Sunday. An interim deal between Tehran and...
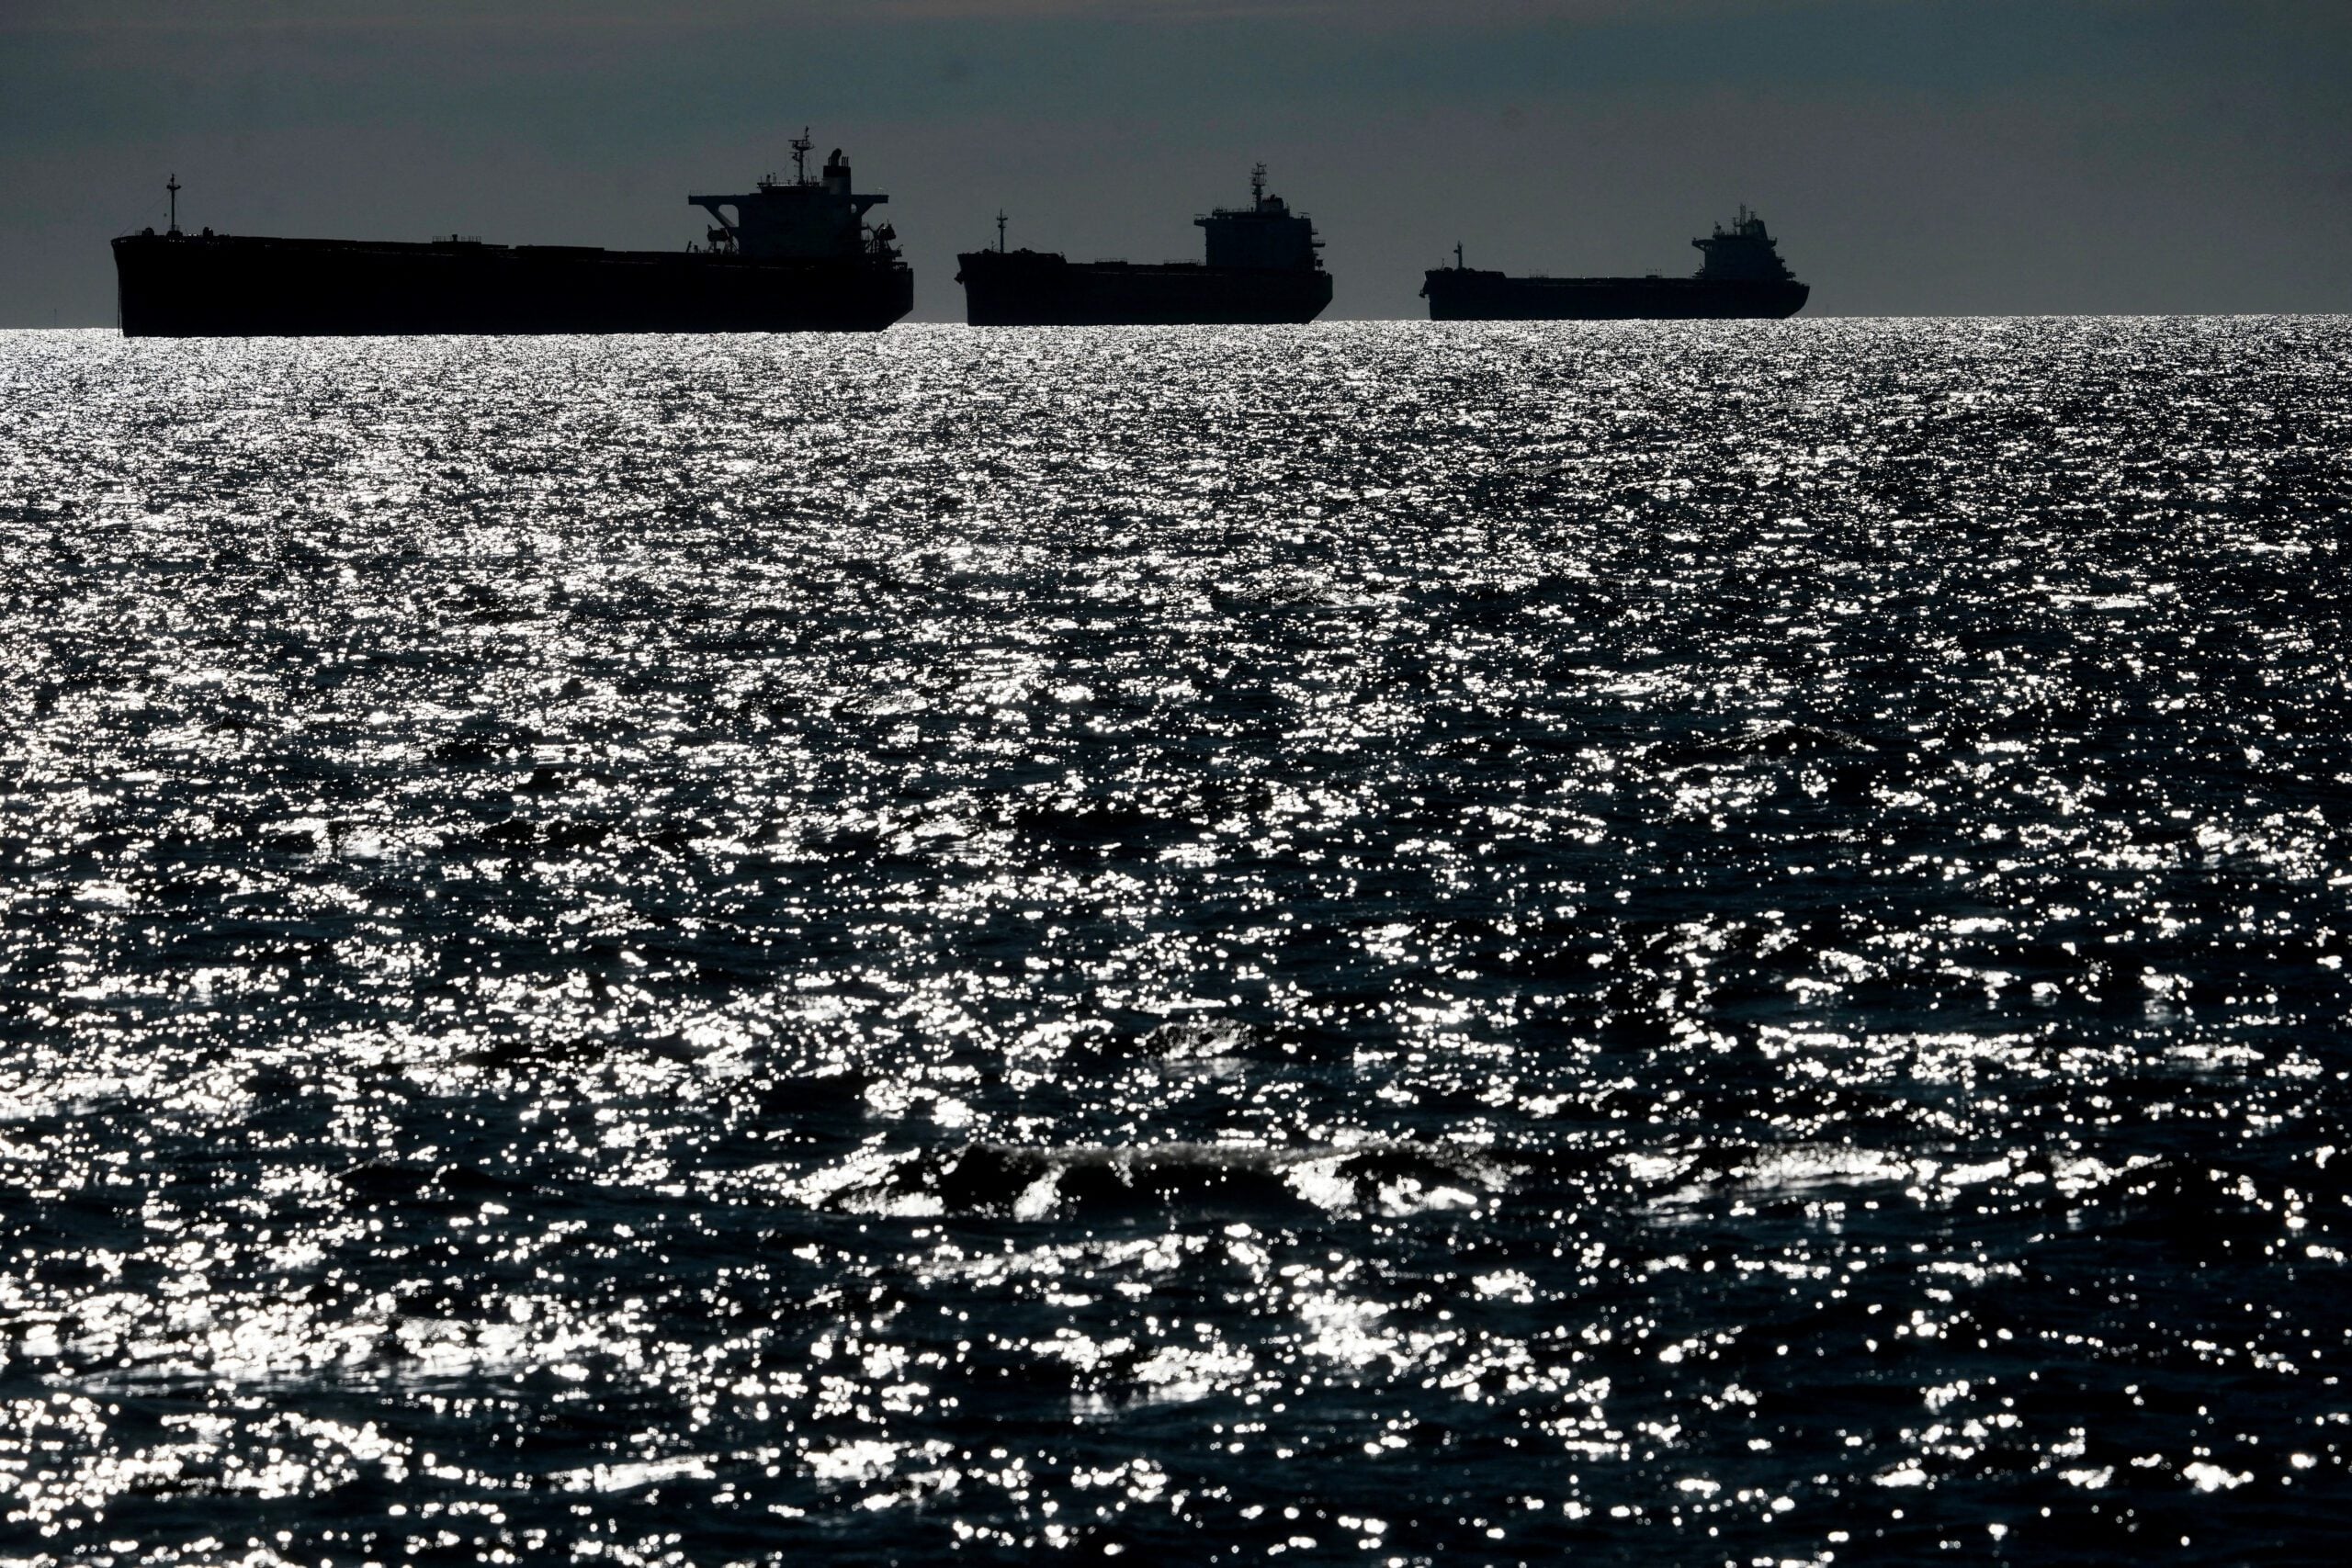
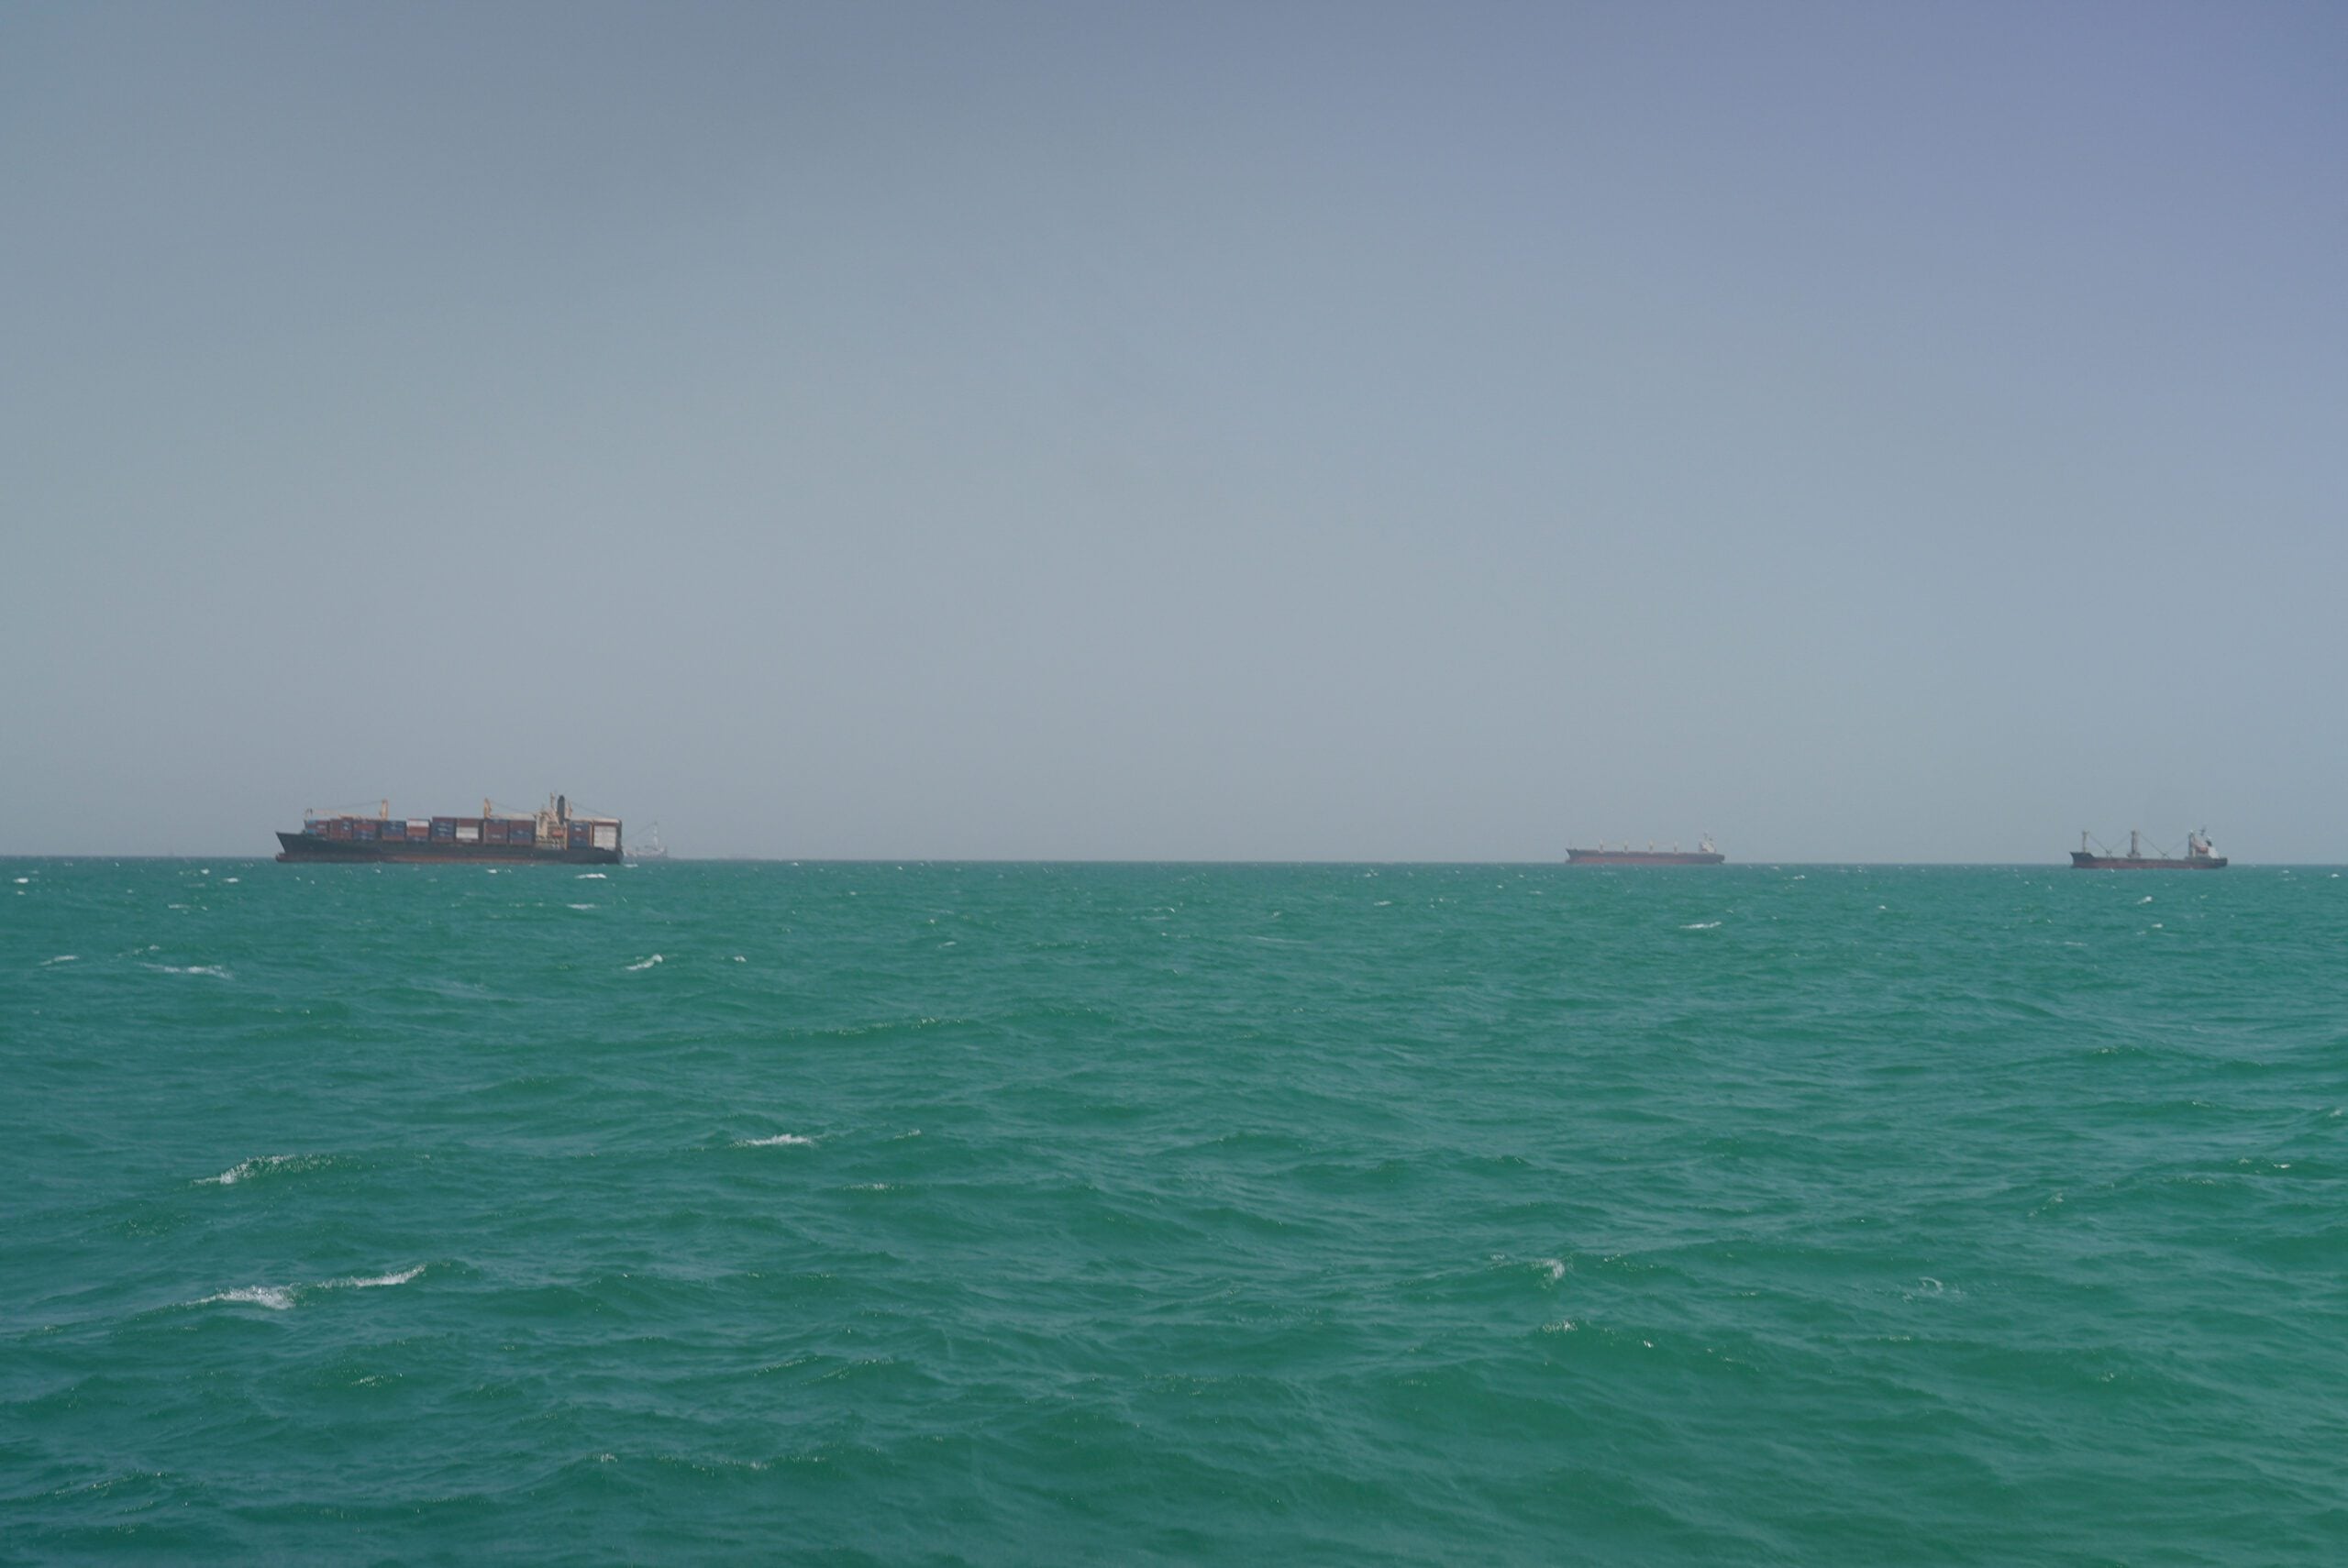
At the UAE port of Fujairah, conveyor belts offloaded grain from bulk carriers on Wednesday, while crude oil flowed through pipes and onto tankers berthed along its quay.
May 6, 2026
Total Views: 744
Get The Industry’s Go-To News
Subscribe to gCaptain Daily and stay informed with the latest global maritime and offshore news
— just like 104,535 professionals
Secure Your Spot
on the gCaptain Crew
Stay informed with the latest maritime and offshore news, delivered daily straight to your inbox
— trusted by our 104,535 members
Your Gateway to the Maritime World!
Essential news coupled with the finest maritime content sourced from across the globe.

 Join The Club