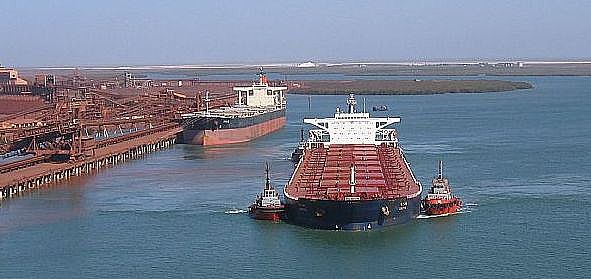
Bulk carrier departing Port Hedland, Australia. File image courtesy Port Hedland Port Authority
(Bloomberg) — Australia’s Port Hedland shipped the most iron ore on a daily basis last month as suppliers increased output through the world’s largest bulk-export terminal.
A total of 1.27 million metric tons were shipped each day in February, according to Bloomberg calculations based on port authority data on Wednesday. That surpassed the previous high of 1.21 million tons a day in September. Daily shipments of the raw material to China averaged 1.08 million tons last month, ahead of the previous record of 1.033 million tons in August.
Low-cost iron ore producers in Australia including BHP Billiton Ltd. and Fortescue Metals Group Ltd., which route their cargoes through Port Hedland, are boosting shipments, seeking to squeeze out less competitive rivals. Prices sank 47 percent in 2014 and extended their decline this year as the jump in supplies spurred a glut just as China’s economy slowed. The port serves Australia’s ore-rich Pilbara region.
“Australia has really been winning market share,” Ralph Leszczynski, Singapore-based head of research at Banchero Costa & Co., a Genoa-based shipbroker, said by phone on Wednesday. Australian supplies are still growing, while high-cost mines in China and elsewhere are closing, according to Leszczynski.
Shipments to China through the port totaled 30.25 million tons in February compared with 30.15 million tons in January, and 21.3 million a year earlier, the data showed. Total exports were 35.7 million tons in February compared with 36.8 million in January and 27.8 million a year earlier, it showed.
Global Glut
The global glut will surge to 437 million tons in 2018 from 184 million tons this year, Morgan Stanley said in a report on Feb. 22. China’s imports will rise to about 964 million tons by 2018, according to the bank. Last year, the top steelmaker imported 932.51 million tons, China’s customs data show.
Australia increased its share of China’s overseas purchases to 59 percent last year from 51 percent in 2013, according to customs data. Brazil’s share was 18 percent from 19 percent in 2013, while exports from the rest of the world contracted to 23 percent from 30 percent. The figures were based on calculations derived from China’s monthly trade data by origin.
Ore with 62 percent content delivered to Qingdao, China, fell 0.5 percent to $61.94 a dry ton on Wednesday, according to Metal Bulletin Ltd. Prices dropped to $61.20 on Feb. 9, the lowest on record going back to May 2009. The commodity lost 13 percent this year.
(c) 2015 Thomson Reuters, All Rights Reserved
Unlock Exclusive Insights Today!
Join the gCaptain Club for curated content, insider opinions, and vibrant community discussions.

 Join The Club