Pirate maps have long been the a source of intrigue but modern day treasure hunters more often use advance technology like remote operated vehicles and sonar systems than maps stamped with an X. Neverless, pirate maps have survived to modern day and are equally intriguing as those found in archives… but they have a different purpose. Here are a few modern day pirate maps but remember dead men tell no tales and there is no gold to be found on these maps… well unless your in blackwater.
LIVE PIRACY MAP – 2008
This map shows all the piracy and armed robbery incidents reported to the Piracy Reporting Centre during 2008. This division of the International Maritime Bureau (IMB) works to protect the integrity of international trade by seeking out fraud and malpractice. The organization combines traditional reporting tools like a piracy hotline with a wide variety of IT sources to keep member informed of dangerous situation in real time.
This map by UNOSAT, the UN Institute for Training and Research’s (UNITAR) Operational Satellite Applications Programme, illustrates reported incidents of piracy in the Gulf of Aden from January to 30 September 2008. Satellite imagery has been used in this analysis for the identification of suspected hijacked vessel locations and UNOSAT has combined this imagery with public media reports. The result is the map above which highlights the most troublesome incidents with an intensity color scale. You can find the hi resolution version of the map HERE.
UNOSAT Identification Of Hijacked Vessels
In addiiton to mapping information UNOSAT also helps athourities identify hijacked ships. This map was developed in response to a UN Security Council and IMO resolution calling for continued monitoring of Somali pirate activity. A range of satellite data were used in this analysis for the identification of coastal settlements and anchorage sites of suspected hijacked vessels. Click HERE for the hi resolution version.
Here is a video describing the development of these maps:
.
Infographics
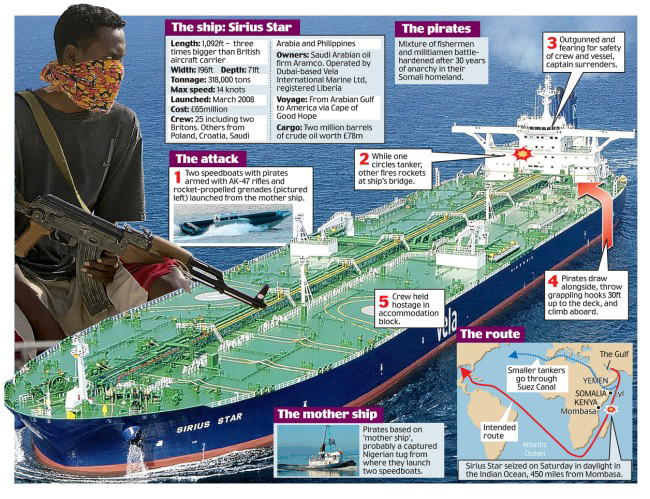
Information graphics or infographics are visual representations of information, data or knowledge. These are the types of images you often find in newspapers and magazines. The above image is an infographic produced by the Russian News & Information Agency illustrating the economic impact of pirate attacks.
This graphic shows the attack on the super tanker M/V Sirius Star which was hundereds of miles from the coast of Somalia as it headed south to round the Cape Of Good Hope.
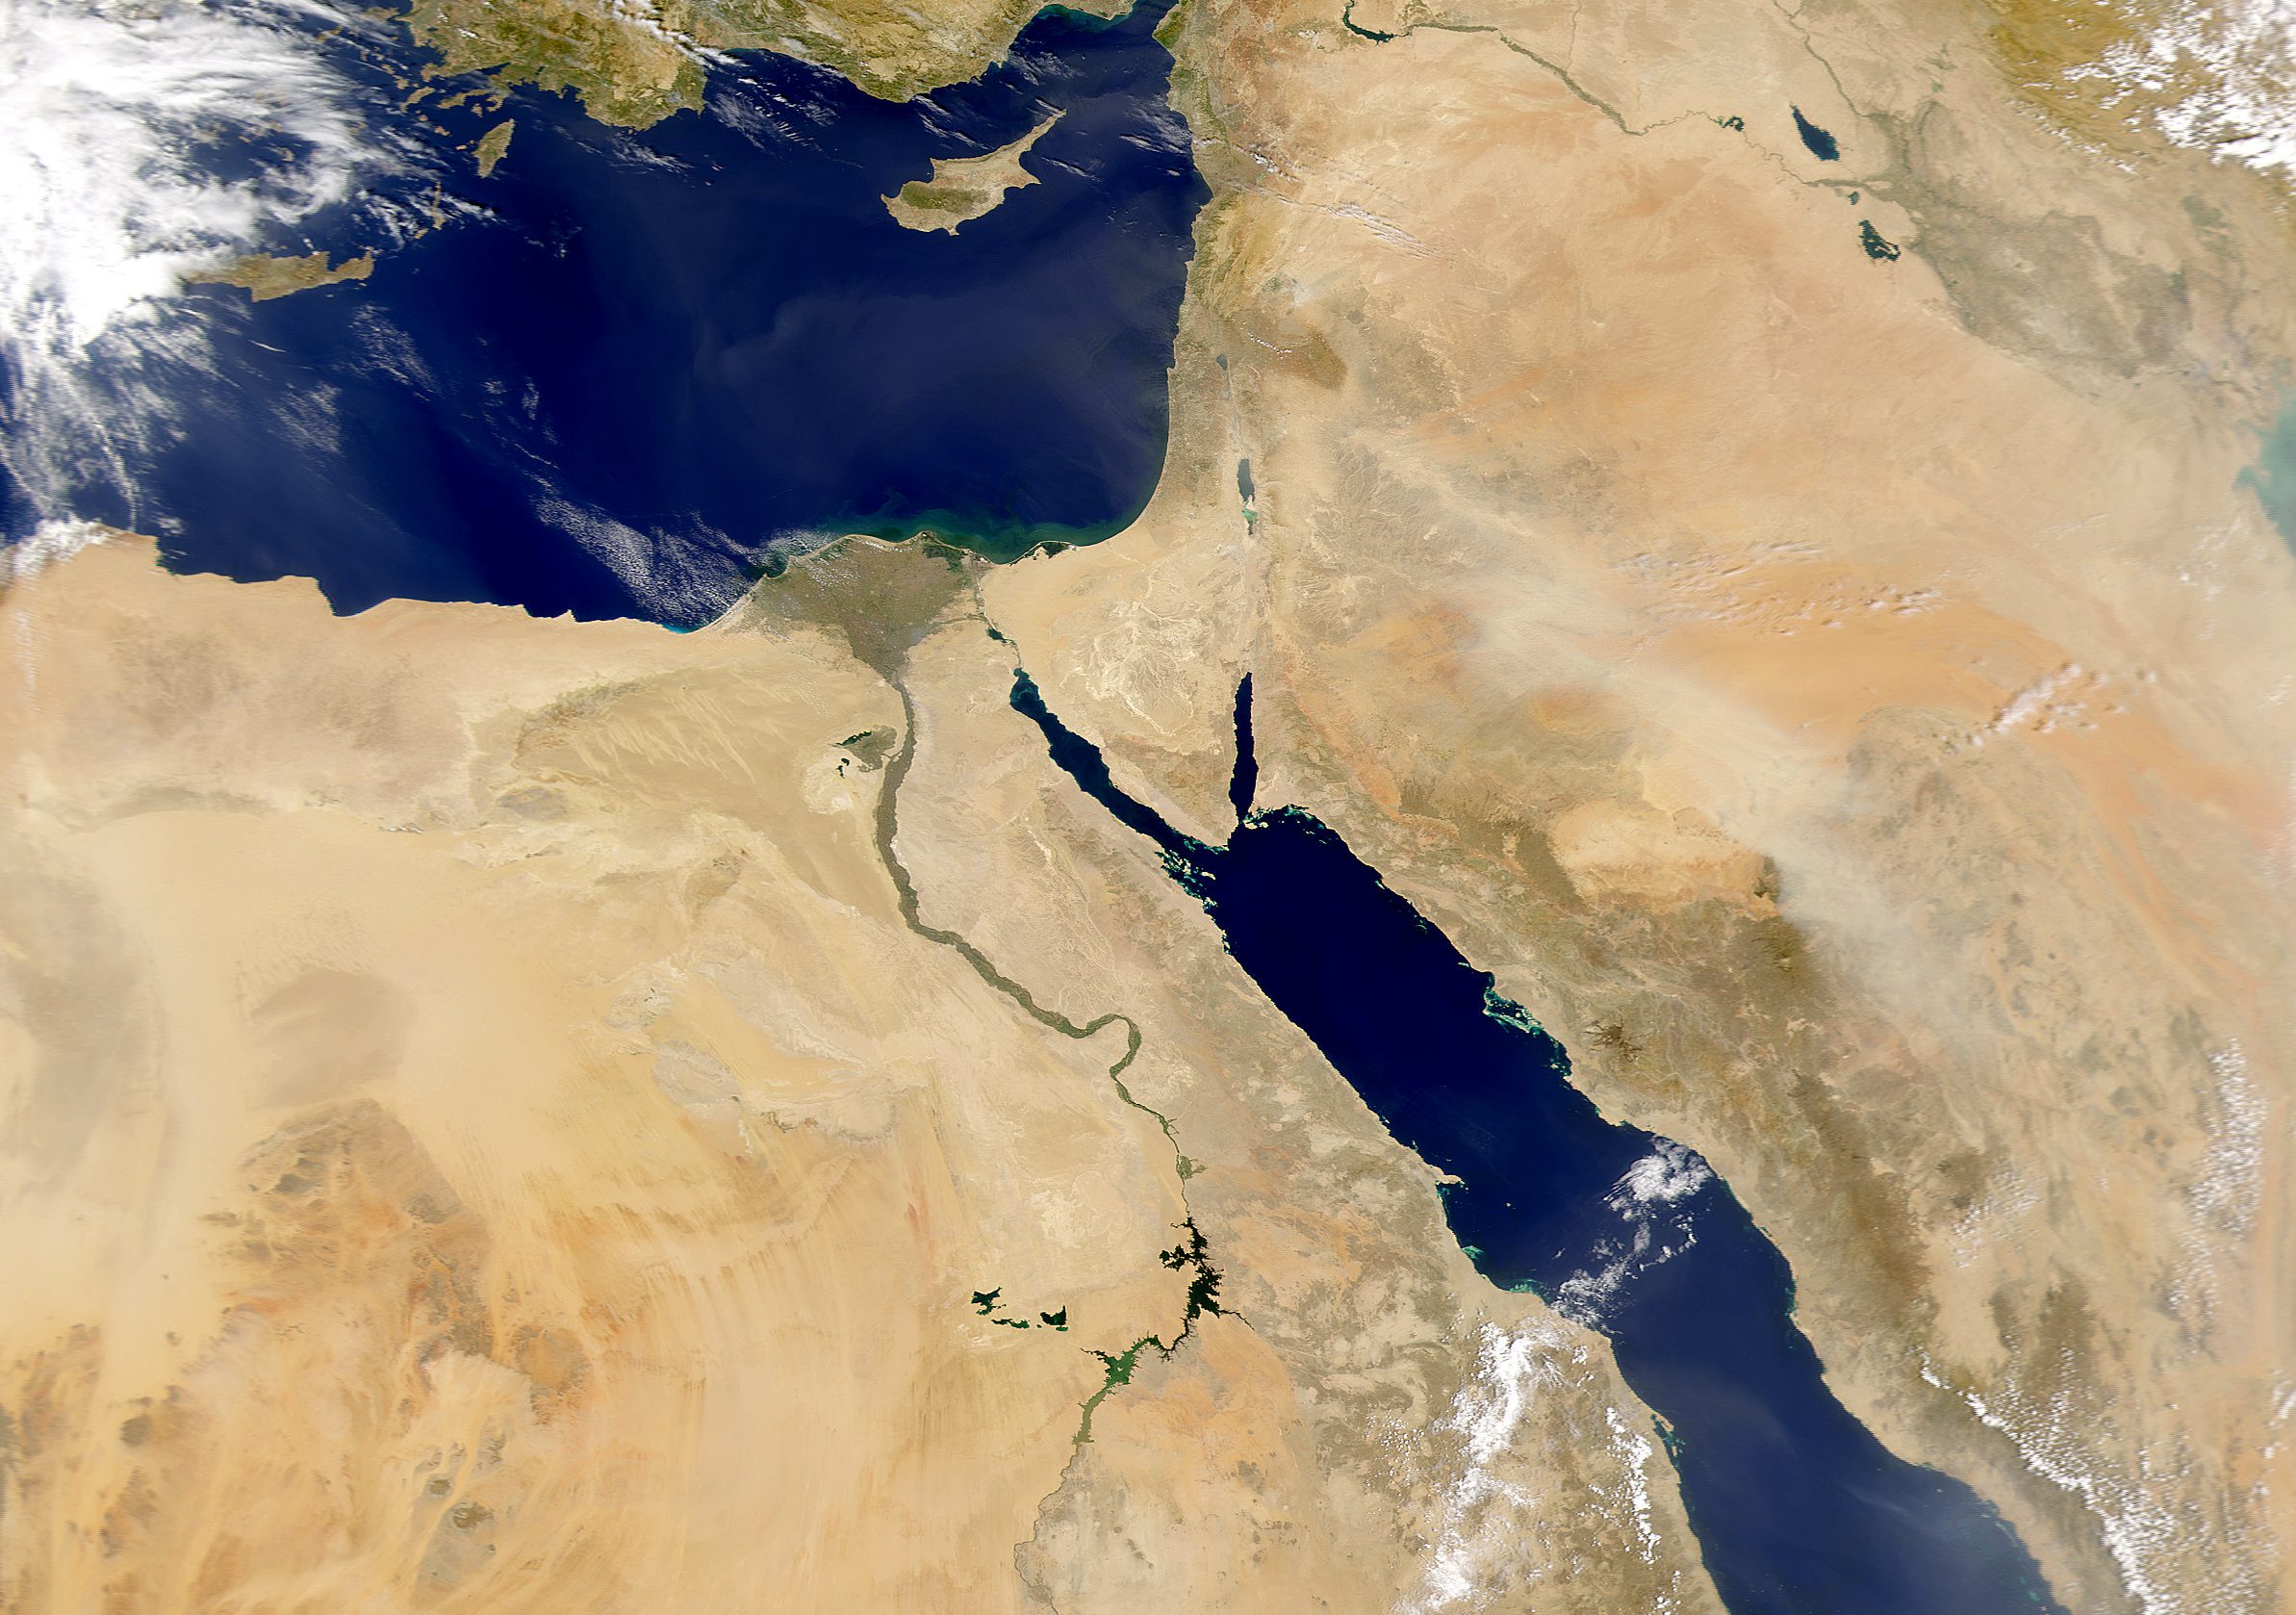
Oil Choke Points
This map from NewScientist clearly shows the choke points in the shipping of oil. Along with the coast of Somalia, the Straight Of Malacca is also shown. Click HERE for the full interactive version of this map.
More Maps, Charts And Data
Have you found an interesting piracy graphic online? If so please leave a comment below linking to the resource.
Unless Iran reins in its proxy force, the US and its allies may have to turn to the playbook that defeated piracy off East Africa a decade ago. By James Stavridis (Bloomberg...
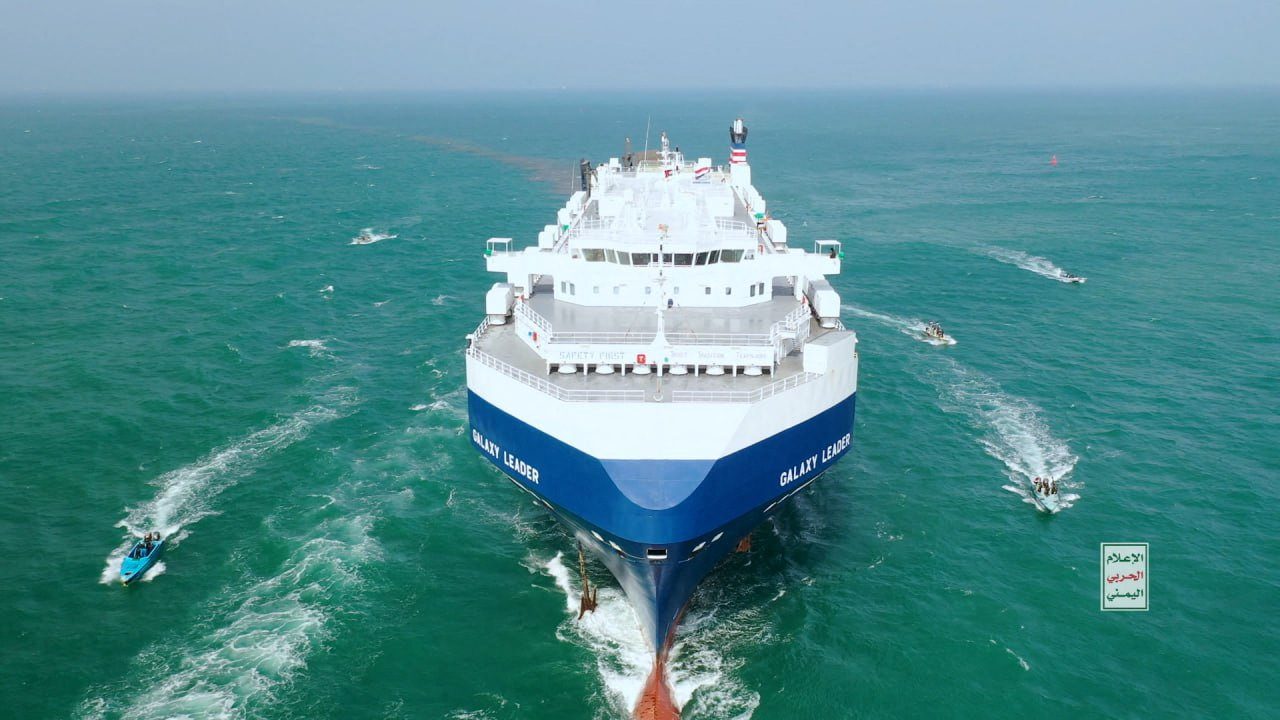
UPDATED – Original article said two ships were seized by Dan Williams (Reuters) – Israel said on Sunday that Yemen’s Houthis had seized a British-owned and Japanese-operated a (Roll-On Roll-Off) cargo ship (Galaxy Leader)...
Yesterday in Oakland, Pro-Palestinian protesters advocating for a cease-fire in Gaza illegally entered port facilities in an attempt to halt the U.S. military supply ship, M/V Cape Orlando. This vessel,...
November 4, 2023
Total Views: 14266
Why Join the gCaptain Club?
Access exclusive insights, engage in vibrant discussions, and gain perspectives from our CEO.
This website uses cookies to improve your experience while you navigate through the website. Out of these, the cookies that are categorized as necessary are stored on your browser as they are essential for the working of basic functionalities of the website. We also use third-party cookies that help us analyze and understand how you use this website. These cookies will be stored in your browser only with your consent. You also have the option to opt-out of these cookies. But opting out of some of these cookies may affect your browsing experience.
Necessary cookies are absolutely essential for the website to function properly. This category only includes cookies that ensures basic functionalities and security features of the website. These cookies do not store any personal information.
Any cookies that may not be particularly necessary for the website to function and is used specifically to collect user personal data via analytics, ads, other embedded contents are termed as non-necessary cookies. It is mandatory to procure user consent prior to running these cookies on your website.

 Join The Club