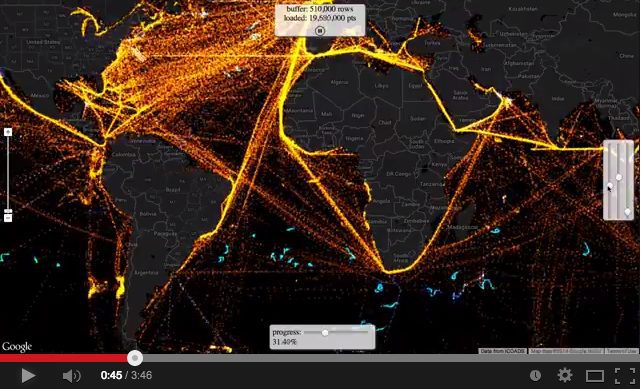
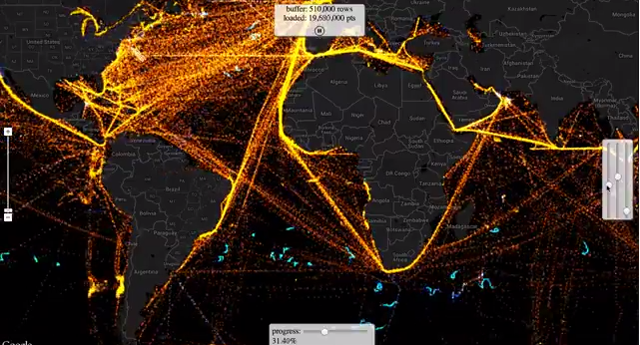
The International Comprehensive Ocean-Atmosphere Data Set (ICOADS) is “probably the most complete and heterogeneous collection of surface marine data in existence,” according to NOAA, and consists of a digital database of 261 million weather observations made by ships, weather ships, and weather buoys spanning the years 1662 to 2007.
And it’s just been animated by Google Maps developers Paul Saxman and Brendan Kenny.
In the below visualization, ships and vessels are colored red-yellow, and other observing platforms (buoys, etc.) are colored blue-cyan and the visualization progresses on a time scale from the earliest to most-recent data.
by John Konrad (gCaptain) Contrary to popular belief, Maersk is not the world’s largest shipping company, nor is Delta the world’s largest airline. However, both companies have substantial contracts with...
by Kevin Hamilton (University of Hawaii) In 2021, an expedition off the icy northern Greenland coast spotted what appeared to be a previously uncharted island. It was small and gravelly,...
By John Konrad (gCaptain) Dr. Salvatore R. Mercogliano, a maritime historian and longtime contributor to gCaptain, recently celebrated a significant milestone for his YouTube channel, “What’s Going On With Shipping,”...
June 26, 2023
Total Views: 1617
Why Join the gCaptain Club?
Access exclusive insights, engage in vibrant discussions, and gain perspectives from our CEO.
This website uses cookies to improve your experience while you navigate through the website. Out of these, the cookies that are categorized as necessary are stored on your browser as they are essential for the working of basic functionalities of the website. We also use third-party cookies that help us analyze and understand how you use this website. These cookies will be stored in your browser only with your consent. You also have the option to opt-out of these cookies. But opting out of some of these cookies may affect your browsing experience.
Necessary cookies are absolutely essential for the website to function properly. This category only includes cookies that ensures basic functionalities and security features of the website. These cookies do not store any personal information.
Any cookies that may not be particularly necessary for the website to function and is used specifically to collect user personal data via analytics, ads, other embedded contents are termed as non-necessary cookies. It is mandatory to procure user consent prior to running these cookies on your website.

 Join The Club