Athens, Greece, November 27, 2012. Globus Maritime Limited (“Globus,” the “Company,” “we,” or “our”), (NASDAQ: GLBS), a dry bulk shipping company, today reported its unaudited consolidated operating and financial results for the three-month and nine-month periods ended September 30, 2012.
Summary of Third Quarter 2012 (“Q3-12”) Results versus Third Quarter 2011 (“Q3-11”)
ï‚· Revenue of $7.4 million versus $9.2 million, a 20% decrease;
ï‚· Voyage expenses of $0.8 million versus $0.9 million, an 11% decrease;
ï‚· Net Revenue of $6.6 million versus $8.3 million, a 20% decrease;
ï‚· Adjusted EBITDA of $3.4 million versus $5.1 million, a 33% decrease; adjusted EBITDA is a measure not in accordance with generally accepted accounting principles (“GAAP”). See a later section of this press release for a reconciliation of non-GAAP financial measures;
ï‚· Total comprehensive loss of $0.8 million versus a total comprehensive income of $1.2 million;
ï‚· Basic loss per share of $0.09, calculated on 10,145,654 weighted average number of shares compared to basic earnings per share of $0.12, calculated on 10,039,794 weighted average number of shares;
ï‚· An average of 7.0 vessels were owned and operated during Q3-12 compared to 6.2 vessels during Q3-11. Average Time Charter Equivalent (“TCE”) decreased by 34% to $9,868 per day from $14,912 per day in Q3-11. A calculation of the TCE is provided in a later section of this release;
ï‚· Fleet utilization improved to 99.2% from 95.9%; fleet utilization is further defined in a later section of this press release.
Summary of Nine Months 2012 (“9M-12”) Results versus Nine Months 2011 (“9M-11”)
ï‚· Revenue of $24.5 million versus $25.4 million, a 4% decrease;
ï‚· Voyage expenses of $3.7 million versus $2.7 million, a 37% increase, including the one-time charge of $1.5 million taken in the second quarter of 2012 relevant to the non-performance by Allied during the charter of the vessel “Star Globe” (as reported in September 2012);
ï‚· Net Revenue of $20.8 million versus $22.7 million, an 8% decrease;
ï‚· Adjusted EBITDA of $11.0 million versus $14.2 million, a 23% decrease;
ï‚· Total comprehensive loss of $1.6 million versus total comprehensive income of $4.6 million;
ï‚· An average of 7.0 vessels were owned and operated during 9M-12 compared to 5.4 vessels during 9M-11. The TCE decreased by 32% to $10,770 per day from $15,910 per day in 9M-11.
ï‚· Fleet utilization was 98.6% versus 98.1% during the same period in 2011.
Dividend Declaration
Based on the reported loss for the third quarter 2012, the Company’s Board of Directors did not declare a dividend for the common shares for the period. The Company has 10,149,325 common shares issued and outstanding as of today.
The Company is continuing the policy of paying out a variable quarterly dividend in excess of 50% of the net income of the previous quarter, subject to any reserves the board of directors may from time to time determine are required. The declaration and payment of dividends, if any, will always be subject to the discretion of the board of directors of the Company. The amount of dividends paid in any period is not indicative of the amount that may be paid in the future. The timing and amount of any dividends declared will depend on, among other things: our earnings, financial condition and anticipated cash requirements and availability, additional acquisitions of vessels, restrictions in our debt arrangements, the provisions of Marshall Islands law affecting the payment of distributions to shareholders, required capital and drydocking expenditures, reserves established by our board of directors, increased or unanticipated expenses, a change in our dividend policy, additional borrowings or future issuances of securities, or as a result of losses in connection with the non-performance of charterers and other factors, many of which will be beyond our control. We can give no assurance that dividends will be paid in the future.
Current Fleet Profile
On the date of this press release Globus’ subsidiaries own and operate seven dry bulk carriers, consisting of four Supramaxes, two Panamaxes and one Kamsarmax.
Current Fleet Deployment
The Panamax “Tiara Globe” is on a time charter with Noor Shipping Services, which began in September 2012 for a minimum period of three months (maximum six months) at $9,000 per day gross.
The vessel “Star Globe” was chartered to Daebo International Shipping Co. Ltd., a charter expected to begin in early December 2012 for a minimum period of four months (maximum six months) at $8,000 per day gross.
The Supramax vessel “River Globe” is trading on the spot market.
Assuming all charter counterparties fully perform under the terms of the respective charters, and based on the earliest redelivery dates, as of the day of this press release, the Company has secured employment approximately 83% of our fleet days for the rest of 2012, 48% for 2013, and 29% for 2014.
Employment Profile
Management Commentary
George Karageorgiou, President and Chief Executive Officer of Globus Maritime Limited, stated: “The third quarter of 2012 was yet another challenging period for our company as our results were negatively affected by weak freight rates. Through the first nine months of 2012, the dry bulk market remained in a cyclical trough characterized by strong supply growth and an inconsistent demand profile reflecting slower growth in the Far East and the fiscal and economic issues in the U.S. and the Eurozone. While this environment continued to weigh on our financial results, we believe that our modern fleet bodes well for Globus to continue to provide customers with the service they require and maintain a high fleet utilization.
“During the third quarter 2012 we employed three of our vessels on short-term charters at the prevailing charter rates, which, at times, were below breakeven levels. This resulted in a 20% decrease in revenues and a 33% decrease in EBITDA versus the same period 2011. By maintaining an opportunistic time charter approach combined with a cost-effective operating platform, we expect to benefit from a market turnaround.
“Looking ahead, we maintain contracted coverage of 83% of our fleet for the remainder of 2012, and 48% in 2013. Our strategy is to continue with short term time charters until a meaningful recovery in charter rates materializes.
“As we are about to enter into 2013, we expect the dry bulk shipping market to remain challenging. Spot and time charter rates continue to hover at historic lows due to supply and demand pressures. Consequently, asset values have dropped steeply in the last year creating attractive fleet expansion opportunities.”
Elias Deftereos, Chief Financial Officer, added:
“Globus’ third quarter results reflect the ongoing instability and weakness in the dry bulk market. As of September 30, 2012, our outstanding debt was $107.3 million versus restricted and unrestricted cash of about $8.7 million. As of the same date, our scheduled debt repayments over the next 12 months amounted to about $9 million, a number that provides us with significant operational cash flow
comfort.
“In the face of these challenging conditions, we continue our strategy of cost containment which produces tangible results, at a time when they are most needed. In this context, daily operating expenses for our fleet during Q3-12 decreased by 6% from the same quarter of 2011. Operational efficiency is one of the most important assets for a company, especially during times of low freight rates.
“Looking forward, we expect to continue facing a challenging rate environment as weaker world economic growth is projected for 2013 alongside with significant fleet supply growth. This difficult operating environment comes along with opportunities to invest in vessels at very attractive valuations.
We believe that Globus will manage the challenging year ahead and will be in a position to capitalize on investment opportunities to expand our fleet as they appear.”
Management Discussion and Analysis of the Results of Operations
Third Quarter 2012 Compared to the Third Quarter 2011
Total comprehensive loss for Q3-12 amounted to $0.8 million versus a total comprehensive income of $1.2 million for Q3-11 mainly due to the following factors:
Revenue
Revenue during Q3-12 reached $7.4 million compared to $9.2 million during Q3-11. The decrease was due to lower charter rates achieved by our vessels working in the spot market. The average TCE rate decreased by 34%, from $14,912 in Q3-11 to $9,868 during Q3-12. Increased vessel supply coupled with negative sentiment on the rate of growth in emerging economies were the main contributors of
reduced rates during the third quarter.
Vessel operating expenses
Vessel operating expenses, which include crew costs, provisions, deck and engine stores, lubricating oils, insurance, maintenance, and repairs, increased by $0.2 million to $2.5 million for Q3-12 versus $2.3 million in Q3-11, a 9% increase mainly attributable to the increase in the size of the fleet.
Average daily operating expenses in Q3-12 fell to $4,611 from $4,901 in Q3-11, a 6% decrease, reflecting our efforts to reduce vessel operating costs.
Amortization of fair value of time charter attached to vessels
Amortization during Q3-12 was $0.5 million compared to $0.3 million during Q3-11. Amortization refers to the fair value of above market time charters attached to the two vessels acquired during the second half of 2011, which is amortized on a straight line basis over the remaining period of the time charters.
Loss/gain on derivative financial instruments
The valuation of our two interest rate swaps at the end of each quarter is affected by the prevailing interest rates at that time. On September 30, 2012, the two interest rate swap agreements (for $25 million in total, or ~23% of our total debt outstanding of $107.3 million) were recorded at fair market value, which is the amount that would be paid by us or to us should those instruments be terminated. A non-cash unrealized gain of $0.2 million was recorded for Q3-12, compared to a non-cash unrealized loss of $0.05 million for Q3-11, a result of the change in the fair market value of the interest rate swaps.
Nine Months 2012 Compared to the Nine Months 2011
Total comprehensive loss for 9M-12 amounted to $1.6 million versus a total comprehensive income of $4.6 million for 9M-11 mainly due to the following factors:
Revenue
Revenue decreased by 4% and reached $24.5 million in the 9M-12 period compared to $25.4 million for the same period in 2011. The decrease is primarily attributable to the 32% decrease in the average TCE rate ($10,770 in 9M-12 versus $15,910 in 9M-11) despite the 27% increase in the number of operating days (from 1,439 in 9M-11 to 1,828 in 9M-12).
Voyage expenses
Voyage expenses during 9M-12 reached $3.7 million, including the one-time charge of about $1.5 million taken in the second quarter of 2012 relevant to the non-performance by Allied during the charter of the vessel “Star Globe” (as reported in September 2012), compared to $2.7 million in 9M-11.
Vessel operating expenses
Vessel operating expenses increased by 32%, from $5.7 million in 9M-11 to $7.5 million for 9M-12, an increase mainly attributable to the increase in the size of our fleet.
Average daily operating expenses dropped from $4,753 in 9M-11 to $4,540 in 9M-12, as a result of our efforts to reduce costs.
Depreciation
Depreciation increased by $1.5 million to $8.7 million in 9M-12 from $7.2 million in 9M-11. The increase in depreciation expense is due to the increased size of our fleet.
Amortization of fair value of time charter attached to vessels
Amortization during 9M-12 was $1.4 million compared to $0.3 million during Q3-11. Amortization refers to the fair value of above market time charters attached to the two vessels acquired during the second half of 2011, which is amortized on a straight line basis over the remaining period of the time charters.
Interest expense and finance costs
Interest expenses grew from $2.0 million in 9M-11 to $2.6 million in 9M-12, attributable primarily to the higher level of bank debt. All of the Company’s bank loans are denominated in U.S. dollars.
Liquidity and capital resources
Net cash generated from operating activities for the nine months ended September 30, 2012 and 2011 was $8.7 million and $14.6 million, respectively.
Net cash used in investing activities for the nine months ended September 30, 2012 and 2011 was $nil and $62.8 million, respectively. For 9M-11 cash used in investing activities predominantly related to purchases of the vessels “Moon Globe” and “Sun Globe”.
Cash used in financing activities for the quarter ended September 30, 2012 mainly consisted of the following:
1) The regular installment totaling $0.5 million to Deutsche Schiffsbank (now Commerzbank)
2) Two regular installments totaling $0.8 million to DVB Bank.
3) an amount of $0.7 million interest paid on our loans.
During Q3-12 we paid a preferred dividend of $37.50 per share to the holders of our Series A Preferred Shares. There are 3,347 Series A Preferred Shares issued and outstanding as of today.
As of September 30, 2012, our cash and bank balances and bank deposits were $8.7 million and our outstanding debt was $107.3 million, while an amount up to $5.5 million remained “undrawn and available” under the Credit Suisse revolving facility.
Scheduled vessel repairs
We incur capital expenditures due to the special surveys and drydockings for our fleet. The vessel “Sun Globe” was drydocked during the third quarter of 2012. We anticipate that two of our vessels will be drydocked in 2013.We budget 20 days per drydocking per vessel. Actual length will vary based on the condition of each vessel, shipyard schedules and other factors.
Conference Call Details
The Company’s management team will host a conference call and simultaneous internet webcast to discuss these results on Wednesday, November 28, 2012, at 9:00 a.m. Eastern Daylight Time.
Investors may access the webcast by visiting the Company’s website at www.globusmaritime.gr and clicking on the webcast link. Participants may also dial into the call 10 minutes prior to the scheduled time using the following numbers: 1-866-819-7111 (from the US), 0800-953-0329 (from the UK), 00800-4413-1378 (from Greece), or +44 (0)1452-542-301 (all other callers). Please quote “Globus Maritime.”
A replay of the conference call will be available until December 5, 2012 by dialing 1-866-247-4222 (from the US), 0800-953-1533 (from the UK), or +44(0)1452 550-000 (all other callers). Access Code: 36407079#. In addition, a replay of the webcast will be available on the Company’s website at www.globusmaritime.gr.
SELECTED CONSOLIDATED FINANCIAL & OPERATING DATA
(1) Net Revenue is computed by subtracting voyage expenses from revenue. Net Revenue is not a recognized measurement under international financial reporting standards (“IFRS”) and should not be considered as an alternative or comparable to net income.
(2) Adjusted EBITDA represents net earnings before interest and finance costs net, gains or losses from the change in fair value of derivative financial instruments, foreign exchange gains or losses, income taxes, depreciation, depreciation of drydocking costs, amortization of fair value of time charter acquired, impairment and gains or losses on sale of vessels. Adjusted EBITDA does not represent and should not be considered as an alternative to total comprehensive income/(loss) or cash generated from operations, as determined by IFRS, and our calculation of Adjusted EBITDA may not be comparable to that reported by other companies. Adjusted EBITDA is not a recognized measurement under IFRS.
Adjusted EBITDA is included herein because it is a basis upon which we assess our financial performance and because we believe that it presents useful information to investors regarding a company’s ability to service and/or incur indebtedness and it is frequently used by securities analysts, investors and other interested parties in the evaluation of companies in our industry.
Adjusted EBITDA has limitations as an analytical tool, and you should not consider it in isolation, or as a substitute for analysis of our results as reported under IFRS. Some of these limitations are:
ï‚· Adjusted EBITDA does not reflect our cash expenditures or future requirements for capital expenditures or contractual commitments;
ï‚· Adjusted EBITDA does not reflect the interest expense or the cash requirements necessary to service interest or principal payments on our debt;
ï‚· Adjusted EBITDA does not reflect changes in or cash requirements for our working capital needs; and
ï‚· other companies in our industry may calculate Adjusted EBITDA differently than we do, limiting its usefulness as a comparative measure.
Because of these limitations, Adjusted EBITDA should not be considered a measure of discretionary cash available to us to invest in the growth of our business.
The following table sets forth a reconciliation of total comprehensive income to Adjusted EBITDA for the periods presented:
Three months ended Nine months ended September 30, September 30,
(1) Ownership days are the aggregate number of days in a period during which each vessel in our fleet has been owned by us.
(2) Available days are the number of ownership days less the aggregate number of days that our vessels are offhire due to scheduled repairs or repairs under guarantee, vessel upgrades or special surveys.
(3) Operating days are the number of available days less the aggregate number of days that the vessels are offhire due to any reason, including unforeseen circumstances.
(4) Bareboat charter days are the aggregate number of days during which the vessels in our fleet are subject to a bareboat charter.
(5) We calculate fleet utilization by dividing the number of operating days during a period by the number of available days during the period.
(6) Average number of vessels is measured by the sum of the number of days each vessel was part of our fleet during a relevant period divided by the number of calendar days in such period.
(7) TCE rates are our revenue less net revenue from our bareboat charters less voyage expenses during a period divided by the number of our available days during the period excluding bareboat charter days, which is consistent with industry standards. TCE is a measure not in accordance with GAAP.
(8) We calculate daily vessel operating expenses by dividing vessel operating expenses by ownership days for the relevant time period excluding bareboat charter days.
The following table reflects the calculation of our daily TCE rates for the periods presented.
About Globus Maritime Limited
Globus is an integrated dry bulk shipping company that provides marine transportation services worldwide and presently owns, operates and manages a fleet of dry bulk vessels that transport iron ore, coal, grain, steel products, cement, alumina and other dry bulk cargoes internationally. Globus’ subsidiaries own and operate seven vessels with a total carrying capacity of 452,886 DWT and a weighted average age of 5.8 years as of September 30, 2012.
Safe Harbor Statement
This communication contains “forward-looking statements” as defined under U.S. federal securities laws. Forward-looking statements provide the Company’s current expectations or forecasts of future events. Forward-looking statements include statements about the Company’s expectations, beliefs, plans, objectives, intentions, assumptions and other statements that are not historical facts or that are
not present facts or conditions. Words or phrases such as “anticipate,” “believe,” “continue,” “estimate,” “expect,” “intend,” “may,” “ongoing,” “plan,” “potential,” “predict,” “project,” “will” or similar words or phrases, or the negatives of those words or phrases, may identify forward-looking statements, but the absence of these words does not necessarily mean that a statement is not forward-looking. Forwardlooking statements are subject to known and unknown risks and uncertainties and are based on potentially inaccurate assumptions that could cause actual results to differ materially from those expected or implied by the forward-looking statements. The Company’s actual results could differ materially from those anticipated in forward-looking statements for many reasons specifically as
described in the Company’s filings with the Securities and Exchange Commission. Accordingly, you should not unduly rely on these forward-looking statements, which speak only as of the date of this communication. Globus undertakes no obligation to publicly revise any forward-looking statement to reflect circumstances or events after the date of this communication or to reflect the occurrence of unanticipated events. You should, however, review the factors and risks Globus describes in the reports it will file from time to time with the Securities and Exchange Commission after the date of this communication.
For further information please contact:
Globus Maritime Limited +30 210 960 8300
Elias Deftereos, CFO [email protected]
Capital Link – New York +1 212 661 7566
Nicolas Bornozis [email protected]
Matthew Abenante
Chevron Marine Lubricants held the first technical seminar for 2024 on 7 March in Istanbul, Turkey. The event was held in collaboration with Petrol Ofisi Group. The seminar focused on the future...
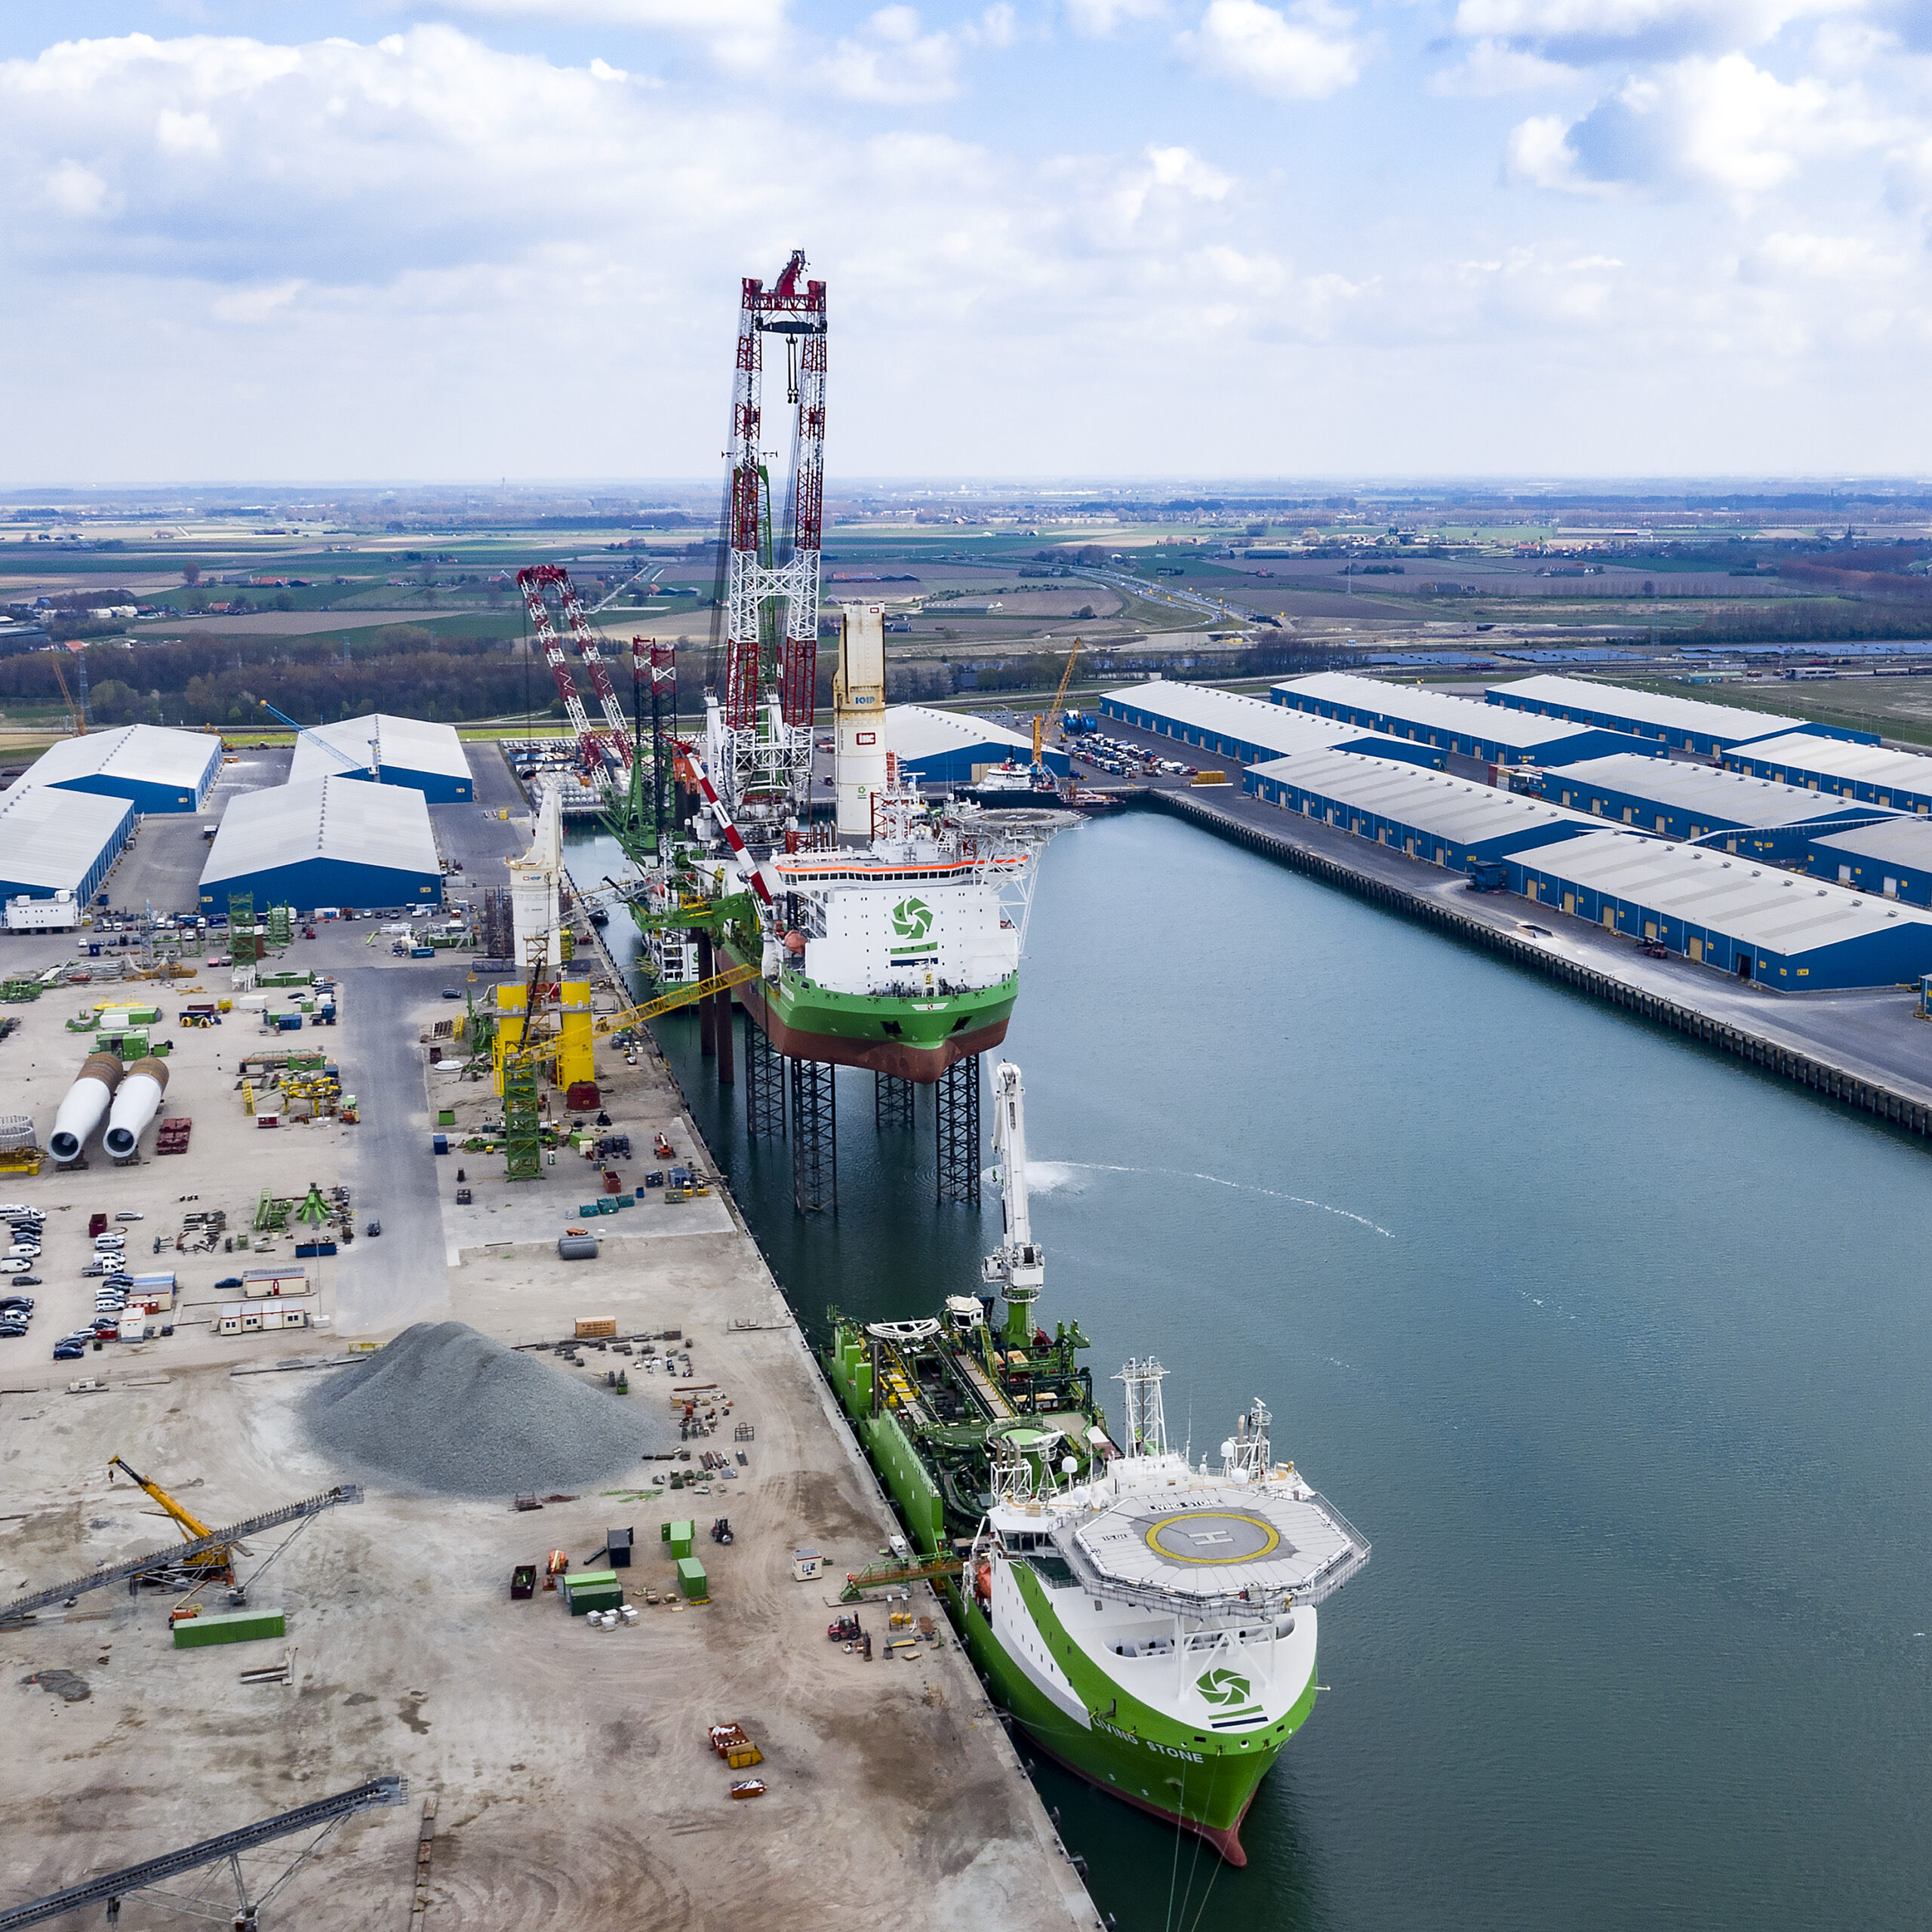
ABB has won the contract to provide a complete shore connection installation for the DEME Base in Vlissingen, the Netherlands. Shore connection enables the diverse fleet of dredgers, offshore construction...
Advanced hybrid network solution on expedition cruise ship enhances customer digital possibilities with high throughput and low latency in uncharted locations around the world Marlink, the leading smart networks and...
March 20, 2024
Total Views: 606
Why Join the gCaptain Club?
Access exclusive insights, engage in vibrant discussions, and gain perspectives from our CEO.
This website uses cookies to improve your experience while you navigate through the website. Out of these, the cookies that are categorized as necessary are stored on your browser as they are essential for the working of basic functionalities of the website. We also use third-party cookies that help us analyze and understand how you use this website. These cookies will be stored in your browser only with your consent. You also have the option to opt-out of these cookies. But opting out of some of these cookies may affect your browsing experience.
Necessary cookies are absolutely essential for the website to function properly. This category only includes cookies that ensures basic functionalities and security features of the website. These cookies do not store any personal information.
Any cookies that may not be particularly necessary for the website to function and is used specifically to collect user personal data via analytics, ads, other embedded contents are termed as non-necessary cookies. It is mandatory to procure user consent prior to running these cookies on your website.

 Join The Club