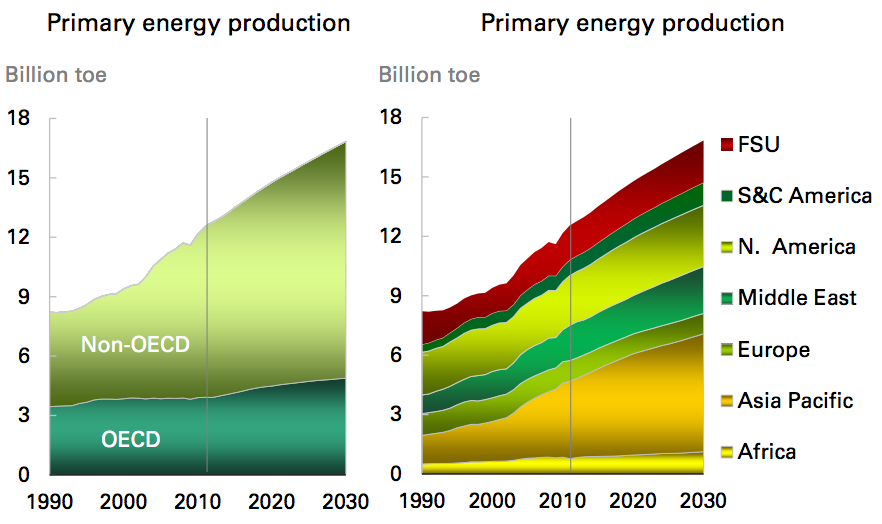
BP presented their 2030 Energy Outlook at the Center for Strategic and International Studies (CSIS) recently in Washington, DC. “The Outlook describes a future that is different in several respects from what many expected just a short while ago,” notes BP Chief Executive Bob Dudley. “We still expect global energy demand to grow – by 36% between 2011 and 2030 – driven by the emerging economies,” particularly those of China and India.
In China, demand for all fossil fuels is projected to expand, led by gas (+283%), oil (+73%), and coal (+34%) as nuclear and renewables surge over 1000%.
(c) BP
Unconventional tight oil and shale gas will continue to play a major role in meeting global energy demand, adds Dudley. Tight oil will account for 9% of global supplies while shale gas is expected to grow by 7% annually to reach 74 Bcf/d by 2030, accounting for 37% of the growth of the world’s natural gas supply.
Oil’s market share will continue to follow the same path it has taken over the past 40 years, slowly declining while coal, a cheap and plentiful energy resource, will be used on a greater scale to ensure China’s power generation needs are met. Global coal demand however, is projected to fall from 71% today to 55% in 2030 as gas doubles its share and oil is unchanged.
BP attributes the decline of oil’s market share to the widespread use of fuel-efficient engines and its high cost, which is spurring further efficiency innovations.
(c) BP
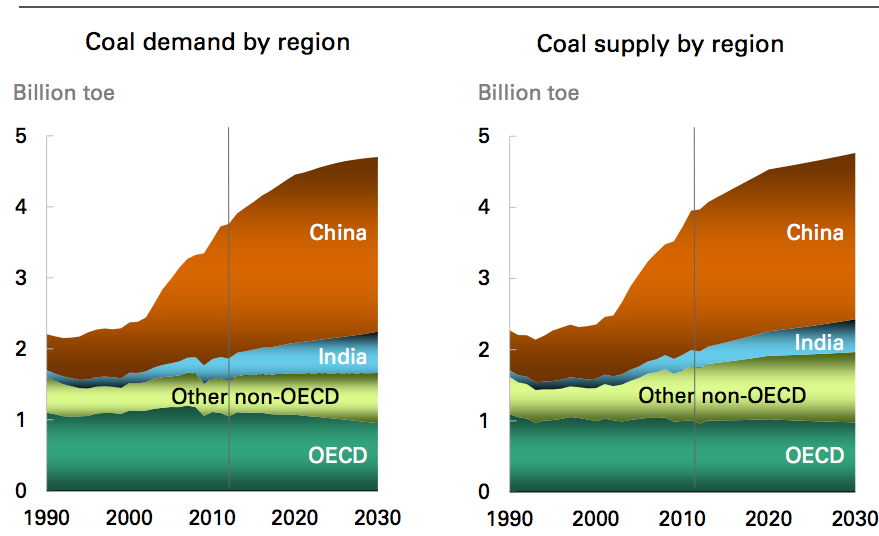
Coal
After oil, coal is expected to be the slowest growing major fuel, with demand rising on average 1.2% a year to 2030. Over the period, growth flattens to just 0.5% a year after 2020. Nearly all (93%) of the net growth in demand to 2030 will come from just China and India, whose combined share of global coal consumption will rise from 57% in 2011 to 65% in 2030. India is expected to overtake the US as second largest coal consumer by 2024.
Oil and Gas Imports
“In the period to 2030, the US becomes nearly self-sufficient in energy, while China and India become increasingly import-dependent,” notes Dudley.
Oil however, is expected to be the slowest growing of the major fuels to 2030, with demand growing at an average of just 0.8% a year. As the United States becomes less energy intensive and as domestic production increases, China is predicted to surpass the United States over the next 5 years to become the biggest net oil importer in the world. By 2030, BP notes, the Chinese are projected to import 75 percent of their total oil consumption, a figure roughly the same as Europe’s total consumption.
Net oil imports to the US are projected to fall another 70 percent by 2030 virtually eliminating half of the US trade deficit, while Europe will be importing over 90 percent of its oil and 80 percent of its natural gas.
Russia will remain the biggest energy exporter in the world, while at the same time Saudi Arabia will regain its pole position as the biggest oil exporter in 2030.
Oil and Gas Production
According to BP, the United States will likely surpass Saudi Arabia this year as the world’s largest oil producer and will hold that title until surpassed by Saudi Arabia again in 2027.
This initial surge can be attributed to tight oil and biofuels production, and will subsequently decline post-2020 as the resource base dips and production costs rise. During this same period, Russia and China will develop their production capabilities and are expected to reach rates of 1.4 Mb/d and 0.5 Mb/d by 2030. China’s shale gas production is expected to hit 6 Bcf/d 2030.
Putting that in perspective, North Dakota increased its production from 100,000 bbls/day to 1 Mb/d in a 5 year period. Currently, the United States is producing 2.1 Mb/d of tight oil (24% of US oil production) and 24 Bcf/d (37%) of natural gas from shale.
(c) BP
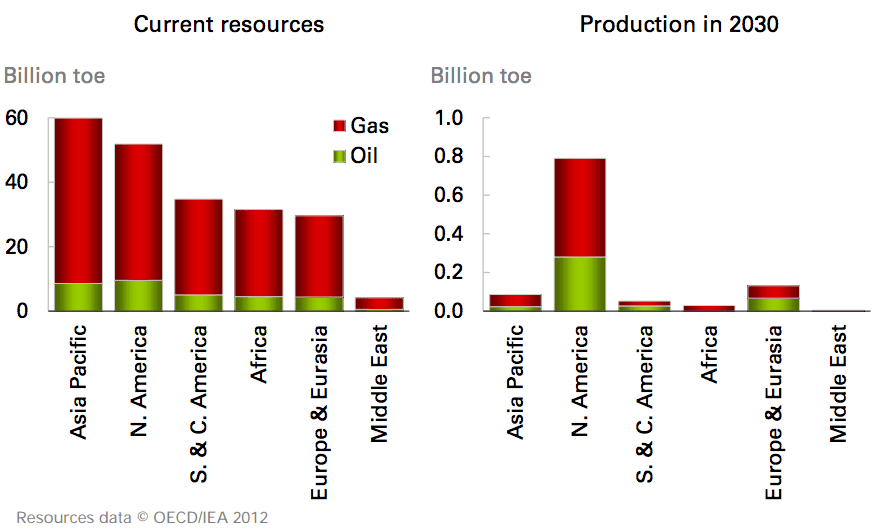
How much energy is left?
BP notes that every year experts have tried to come up with estimates for how much recoverable fossil fuel exists on our planet, but the number continues to rise.
Within tight oil and shale gas alone, BP notes there are estimated technically recoverable resources of 240 billion barrels of tight oil and 200 trillion cubic meters of shale gas. Asia has an estimated 57 Tcm of shale gas and 50 Bbbls of tight oil, versus 47 Tcm and 70 Bbbls respectively for North America.
However, “it’s not what’s below the ground, it’s what’s above the ground,” notes BP.
From a production standpoint of tight oil and shale gas, more than 70% of the world’s production will still be in North America by 2030 with incremental growth elsewhere around the world. “Above ground” factors, BP notes in their Outlook, have been the catalyst for success in bringing these resources to market.
The US has the world’s largest rig fleet with over 1,800 rigs in operation according to Baker Hughes, a majority of which can drill horizontally.
BP notes, “The competitive industry that spurs continued technological innovation, land access facilitated by private ownership, deep financial markets, and favorable fiscal and regulatory terms, will support rapid production growth.”
(c) BP
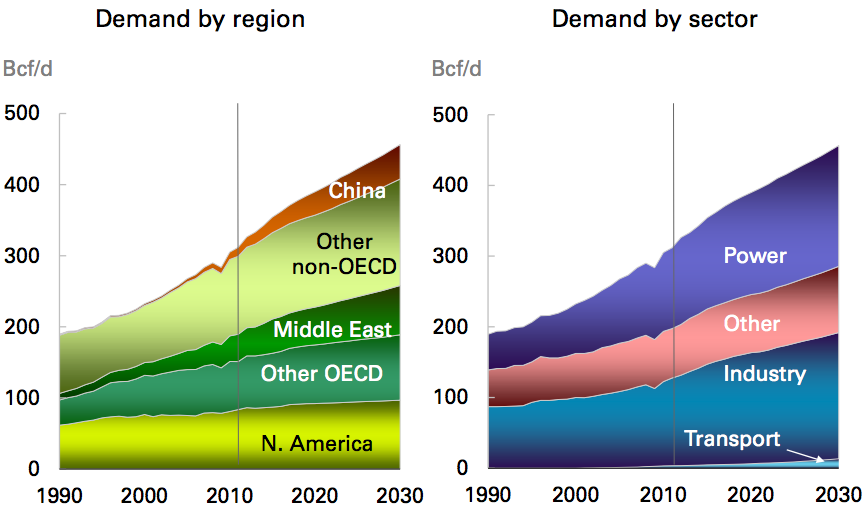
Natural Gas
BP researchers conclude that natural gas will be the fastest growing fossil fuel at 2% per year, reaching 456 Bcf/d (+144) by 2030. By volume, growth is greatest in power generation (+56 Bcf/d) and industry (+54 Bcf/d).
Supported by shale gas, BP predicts North America will become a net exporter of liquefied natural gas (LNG) in 2017, with net exports approaching 8 Bcf/d by 2030. During that same time period, China will increase their domestic production of shale gas to 6 Bcf/d, amounting to 20% of total Chinese gas production. “Nonetheless,” BP notes, “given the fast growth of Chinese consumption, which by 2030 will be larger than the current EU gas market, China still requires rapid import growth (11% p.a.).”
Over the next 17 years, LNG will contribute to an increasing share of global trade as production grows by 4.3% per year. Qatar, the current world-leader in the production of liquefied natural gas, will be surpassed in the coming years as huge facilities off Australia’s northwest shelf come on line.
Demand for LNG will grow primarily from non-OECD countries and will represent 76% of the rise in gas demand and 74% of output growth. On a regional level, Africa is set to overtake the Middle East to become the largest net LNG exporter in 2028.
By 2030, LNG will represent 15.5% of global gas consumption.
Alongside the growth of LNG volumes, BP sees a diversification of trading partners for both exporters and importers. In 1990 each exporter or importer had an average of 2 partners – by 2011 that had risen to 9 and 6 respectively. Nigeria, Qatar and Trinidad & Tobago are leading export diversification, with an average of 20 trading partners in 2011.
Another indicator of increased diversification is the decline in the share of LNG accounted for by the largest importer and largest exporter – from 68% and 39% respectively in 1990 to 23% and 31% respectively in 2011.
Carbon Emissions
While the rate of growth is moderating, carbon emissions are still expected to increase by 26% from 2011 to 2030. Most of the growth will come from non-OECD countries, so that by 2030 70% of CO2 emissions are expected to come from outside the OECD. However, per capita emissions in non-OECD regions will still be less than half those in the OECD.
The Big Picture
Mr. Dudley concludes, “The energy industry is highly competitive and investment will flow to the places that possess the right resources below ground and the right conditions above it. Highlighting the “above ground” factors that have made the US and Canada engines for energy innovation can be instructive for other nations seeking to develop their domestic energy resources.”
“The overall conclusion is that increased demand can be met as long as competition is present to drive innovation, unlock resources and encourage efficiency.”
The Department of the Interior has announced a new rule aiming to ensure that costs related to the decommissioning of offshore platforms are covered by the oil and gas industry,...
(Bloomberg) — For a company that made its name with frontier oil discoveries from Iran to Alaska, BP Plc is notably absent from today’s hottest new oil plays. The company’s...
Virginia-based energy company Dominion Energy has announced the launch of the first U.S.-built and Jones Act-compliant offshore wind turbine installation vessel, the Charybdis. A 472-foot vessel is being built at the...
April 15, 2024
Total Views: 2685
Why Join the gCaptain Club?
Access exclusive insights, engage in vibrant discussions, and gain perspectives from our CEO.
This website uses cookies to improve your experience while you navigate through the website. Out of these, the cookies that are categorized as necessary are stored on your browser as they are essential for the working of basic functionalities of the website. We also use third-party cookies that help us analyze and understand how you use this website. These cookies will be stored in your browser only with your consent. You also have the option to opt-out of these cookies. But opting out of some of these cookies may affect your browsing experience.
Necessary cookies are absolutely essential for the website to function properly. This category only includes cookies that ensures basic functionalities and security features of the website. These cookies do not store any personal information.
Any cookies that may not be particularly necessary for the website to function and is used specifically to collect user personal data via analytics, ads, other embedded contents are termed as non-necessary cookies. It is mandatory to procure user consent prior to running these cookies on your website.

 Join The Club